Rational Function Fan Fair

Sometimes when planning a unit, I browse through the Desmos Activity Builder.  When searching for Rational Functions, I came across Dylan Kane’s Building Rational Functions Activity.  Excellent.  I now had a muse.  Here is what I came up with for college algebra:

0204161424-1.jpg

I like to gush over my students when they do awesome stuff, and this was no exception.  I love it when my classroom is abuzz with sense-making conversations.  I feel like this activity helped students become more comfortable with the structure of rational functions and how that equation structure is reflected in the graphs. Thanks, Dylan, for inspiring some awesome thinking in my class today.

This is Our Theorem – College Algebra

“We came up with a theorem once at my old school.  The teacher has it in a frame behind his desk.”

This statement from one of my college algebra students made me both elated and sad at the same time.  Thrilled because this is the type of mathematics I believe all students should have the chance to engage in on a regular basis.  Disappointed because this type of discovery happens so infrequently in American mathematics classrooms that the incident warranted a sacred place on the wall of this teacher’s room.

In College Algebra, part of today’s learning objective was to define a polynomial function and determine some key features.  I have the awesome types of students that if I were to write down the surly definition and features of a polynomial function onto the whiteboard, each would follow in lock-step and write it in their notebooks solidifying it’s place among mathematical obscurity.

Today, we were going to break that cycle with something different.

But I needed to know where they were at, so I had them write down what they knew about a polynomial function.

0125161447-1.jpg0125161445-1.jpg

After some discussion and leading questions, we were sure that linear, quadratic, cubic, quartic, x^5, x^6, and so on were all polynomial functions.  Awesome. We weren’t, however, as sure about functions including negative exponents, roots, sin/cos, or algebraic fractions.

What makes this group we are sure about special?  Last week, we spent a considerable amount of time on features of functions including domains, end behavior, intercepts, intervals, symmetry, and turning points.  In their groups, I had them examine the graphs of these alleged “polynomials” through the lens of the features of functions.

Two similarities emerged as significant:

0125161453-1.jpg

Questions:  Was this true of all polynomial functions?  And if both conditions were not met, could we exclude it from our known polynomial functions?  Hiding my initial excitement, I then had them look at our list of “questionable” functions. For example, did “y = 9 + 1/x” meet each of these two criteria?

Christopher Danielson suggested that my class give this new theorem a name, so we could refer back to it with ease:

“Class. We have found that all polynomials blah blah blah…” [while writing the statement of the theorem on the board.]  In mathematics, when we have an important finding like this, and when all mathematicians have agreed the finding is true, it gets a name.  Sometimes it is named for a person, such as ‘Fermat’s Last Theorem’; sometimes it is named for what it says, as in ‘The Triangle Inequality’.  But that name makes it possible to refer to it going forward. It helps us to remember and to use the thing we figured out. So we need to name our theorem. Who has a name they’d like to suggest?”

Alas, the excitement of naming the theorem will have to wait until tomorrow.

Somewhere between Concrete Sequential and Abstract Random

It occurred to be relatively early in during the trimester this past fall that my college algebra students (generally) have no idea what I mean when I say “quadratic function.”  This isn’t because they have never heard it, learned it, or used it.  But that technical of a term simply has not stuck around in their long term memory.

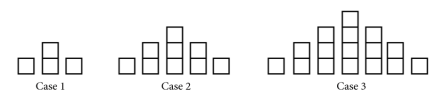
So, similar to linear functions, we start with a pattern:

circle

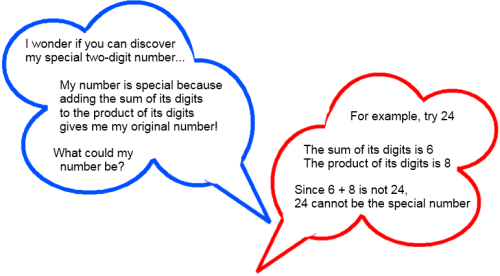
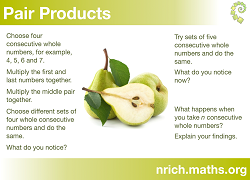
from youcubed.org and visualpatterns.org

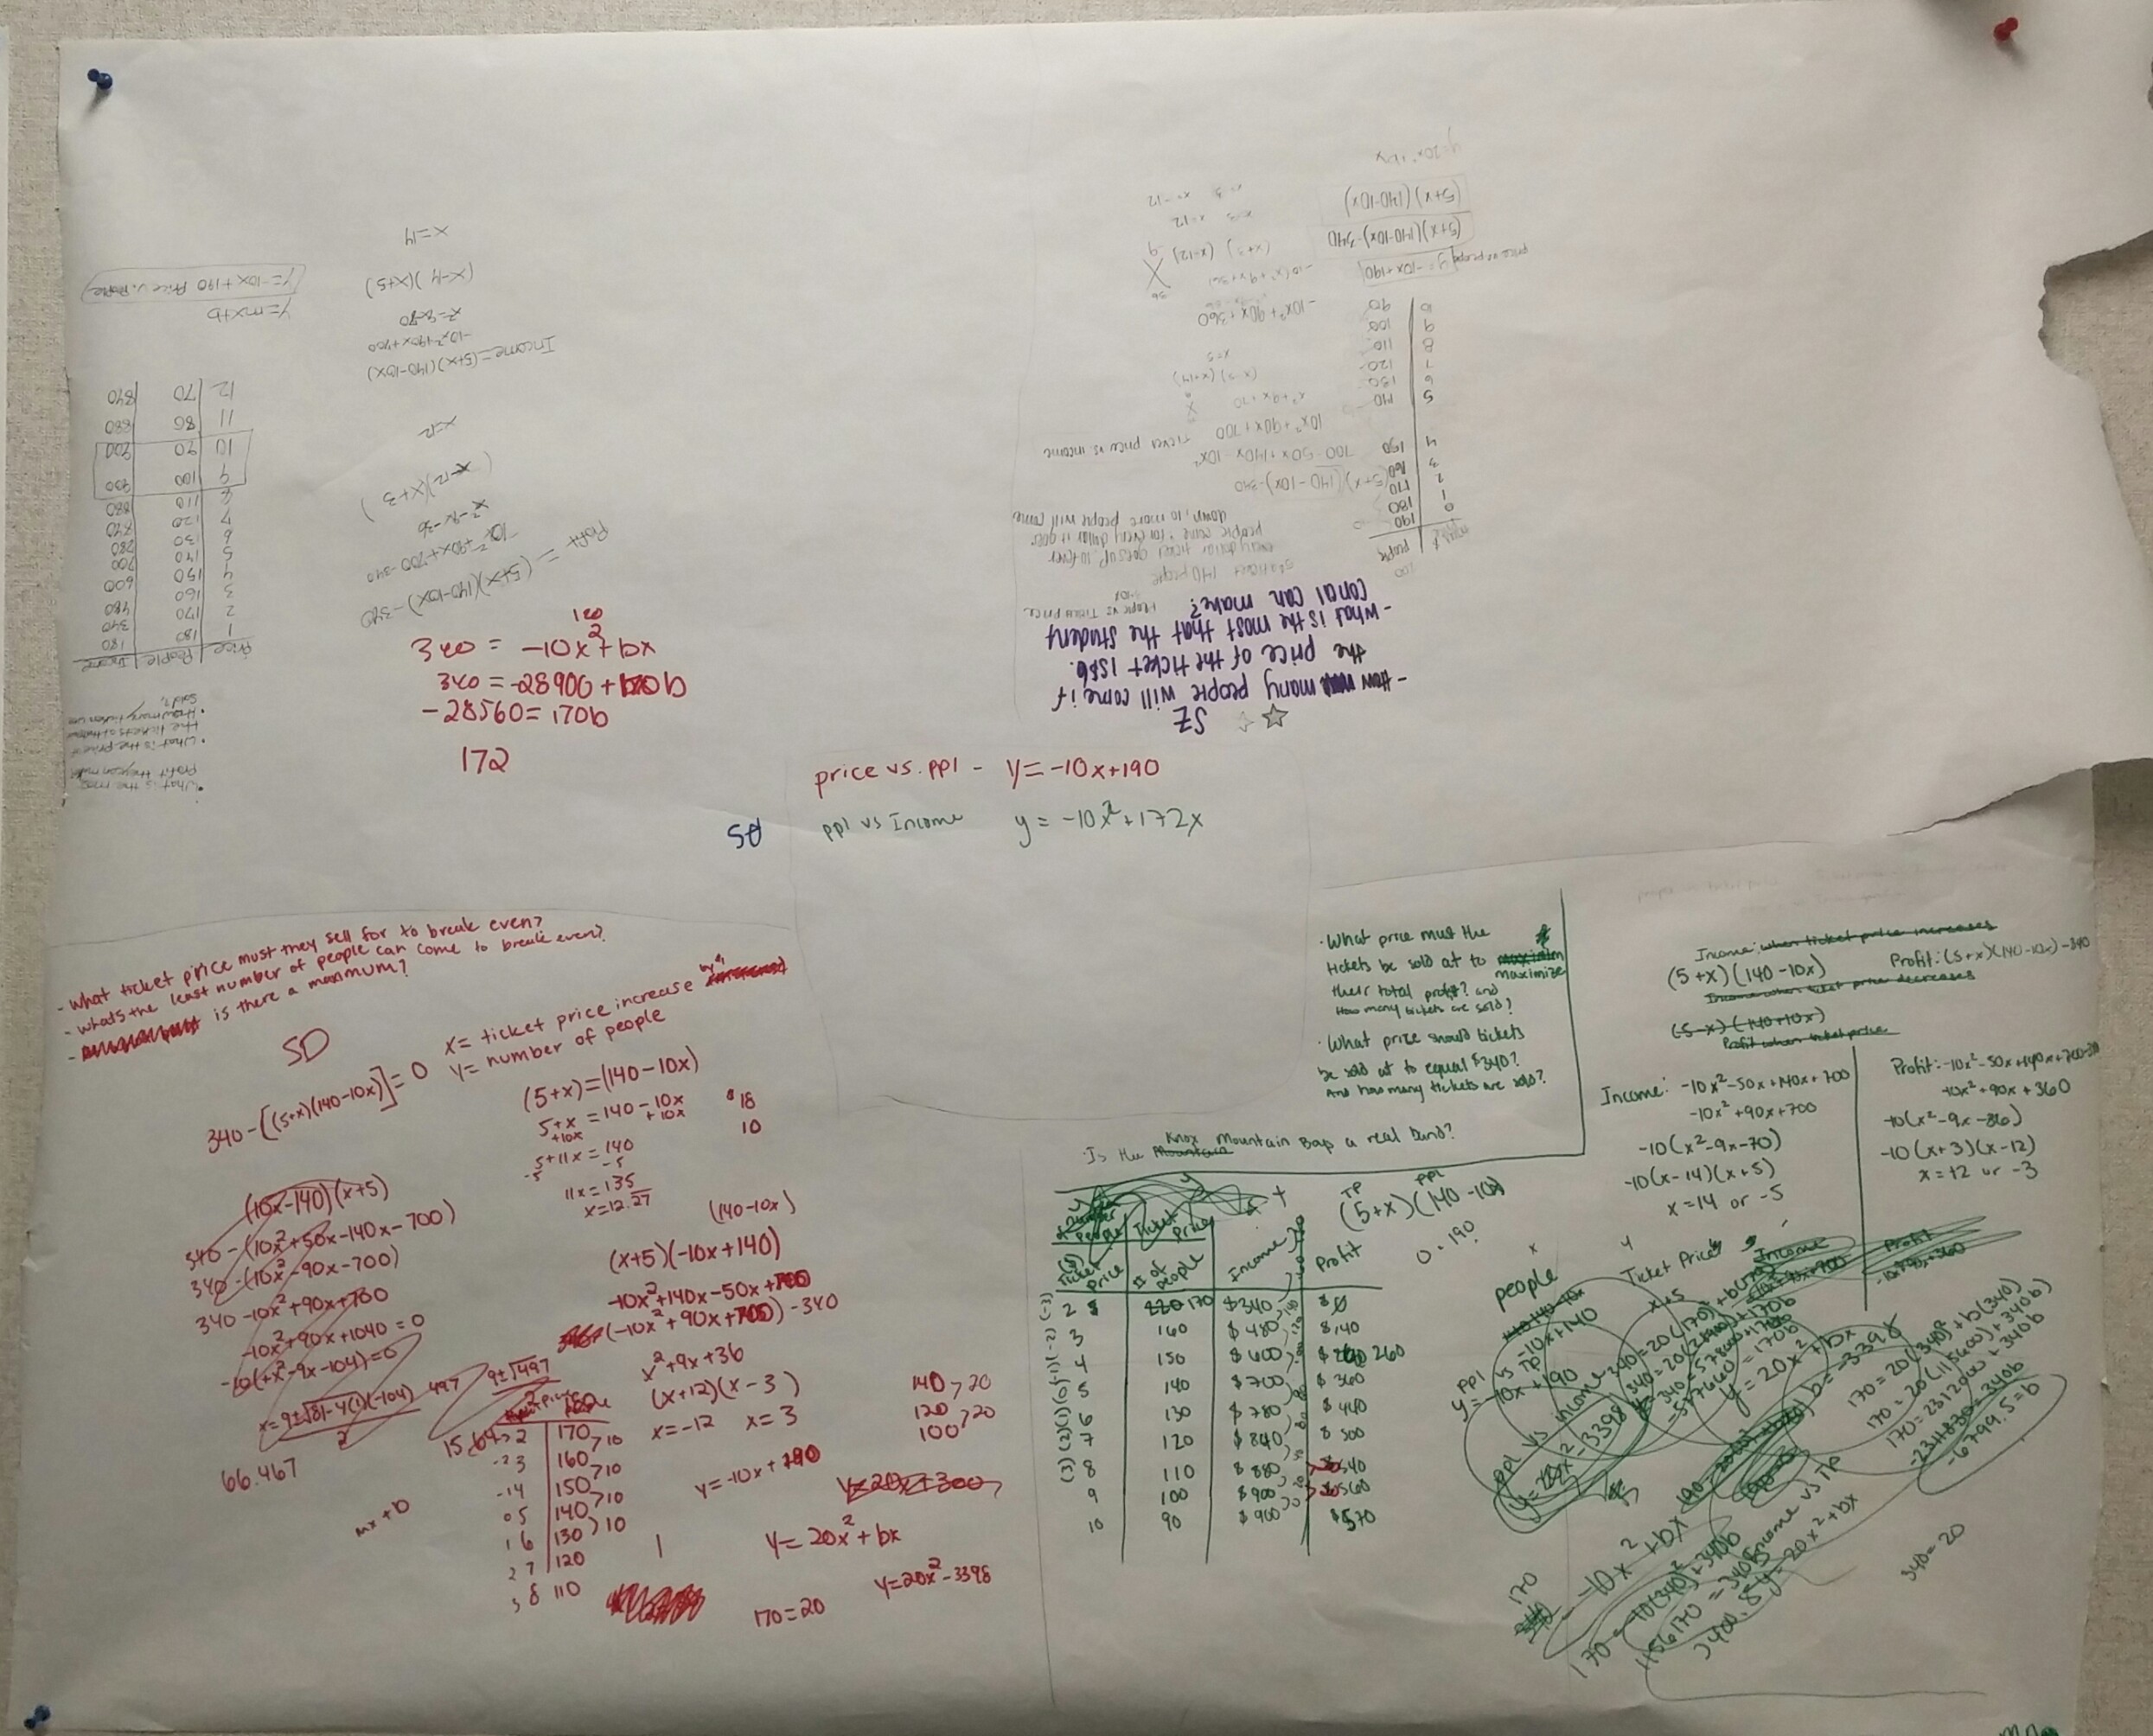
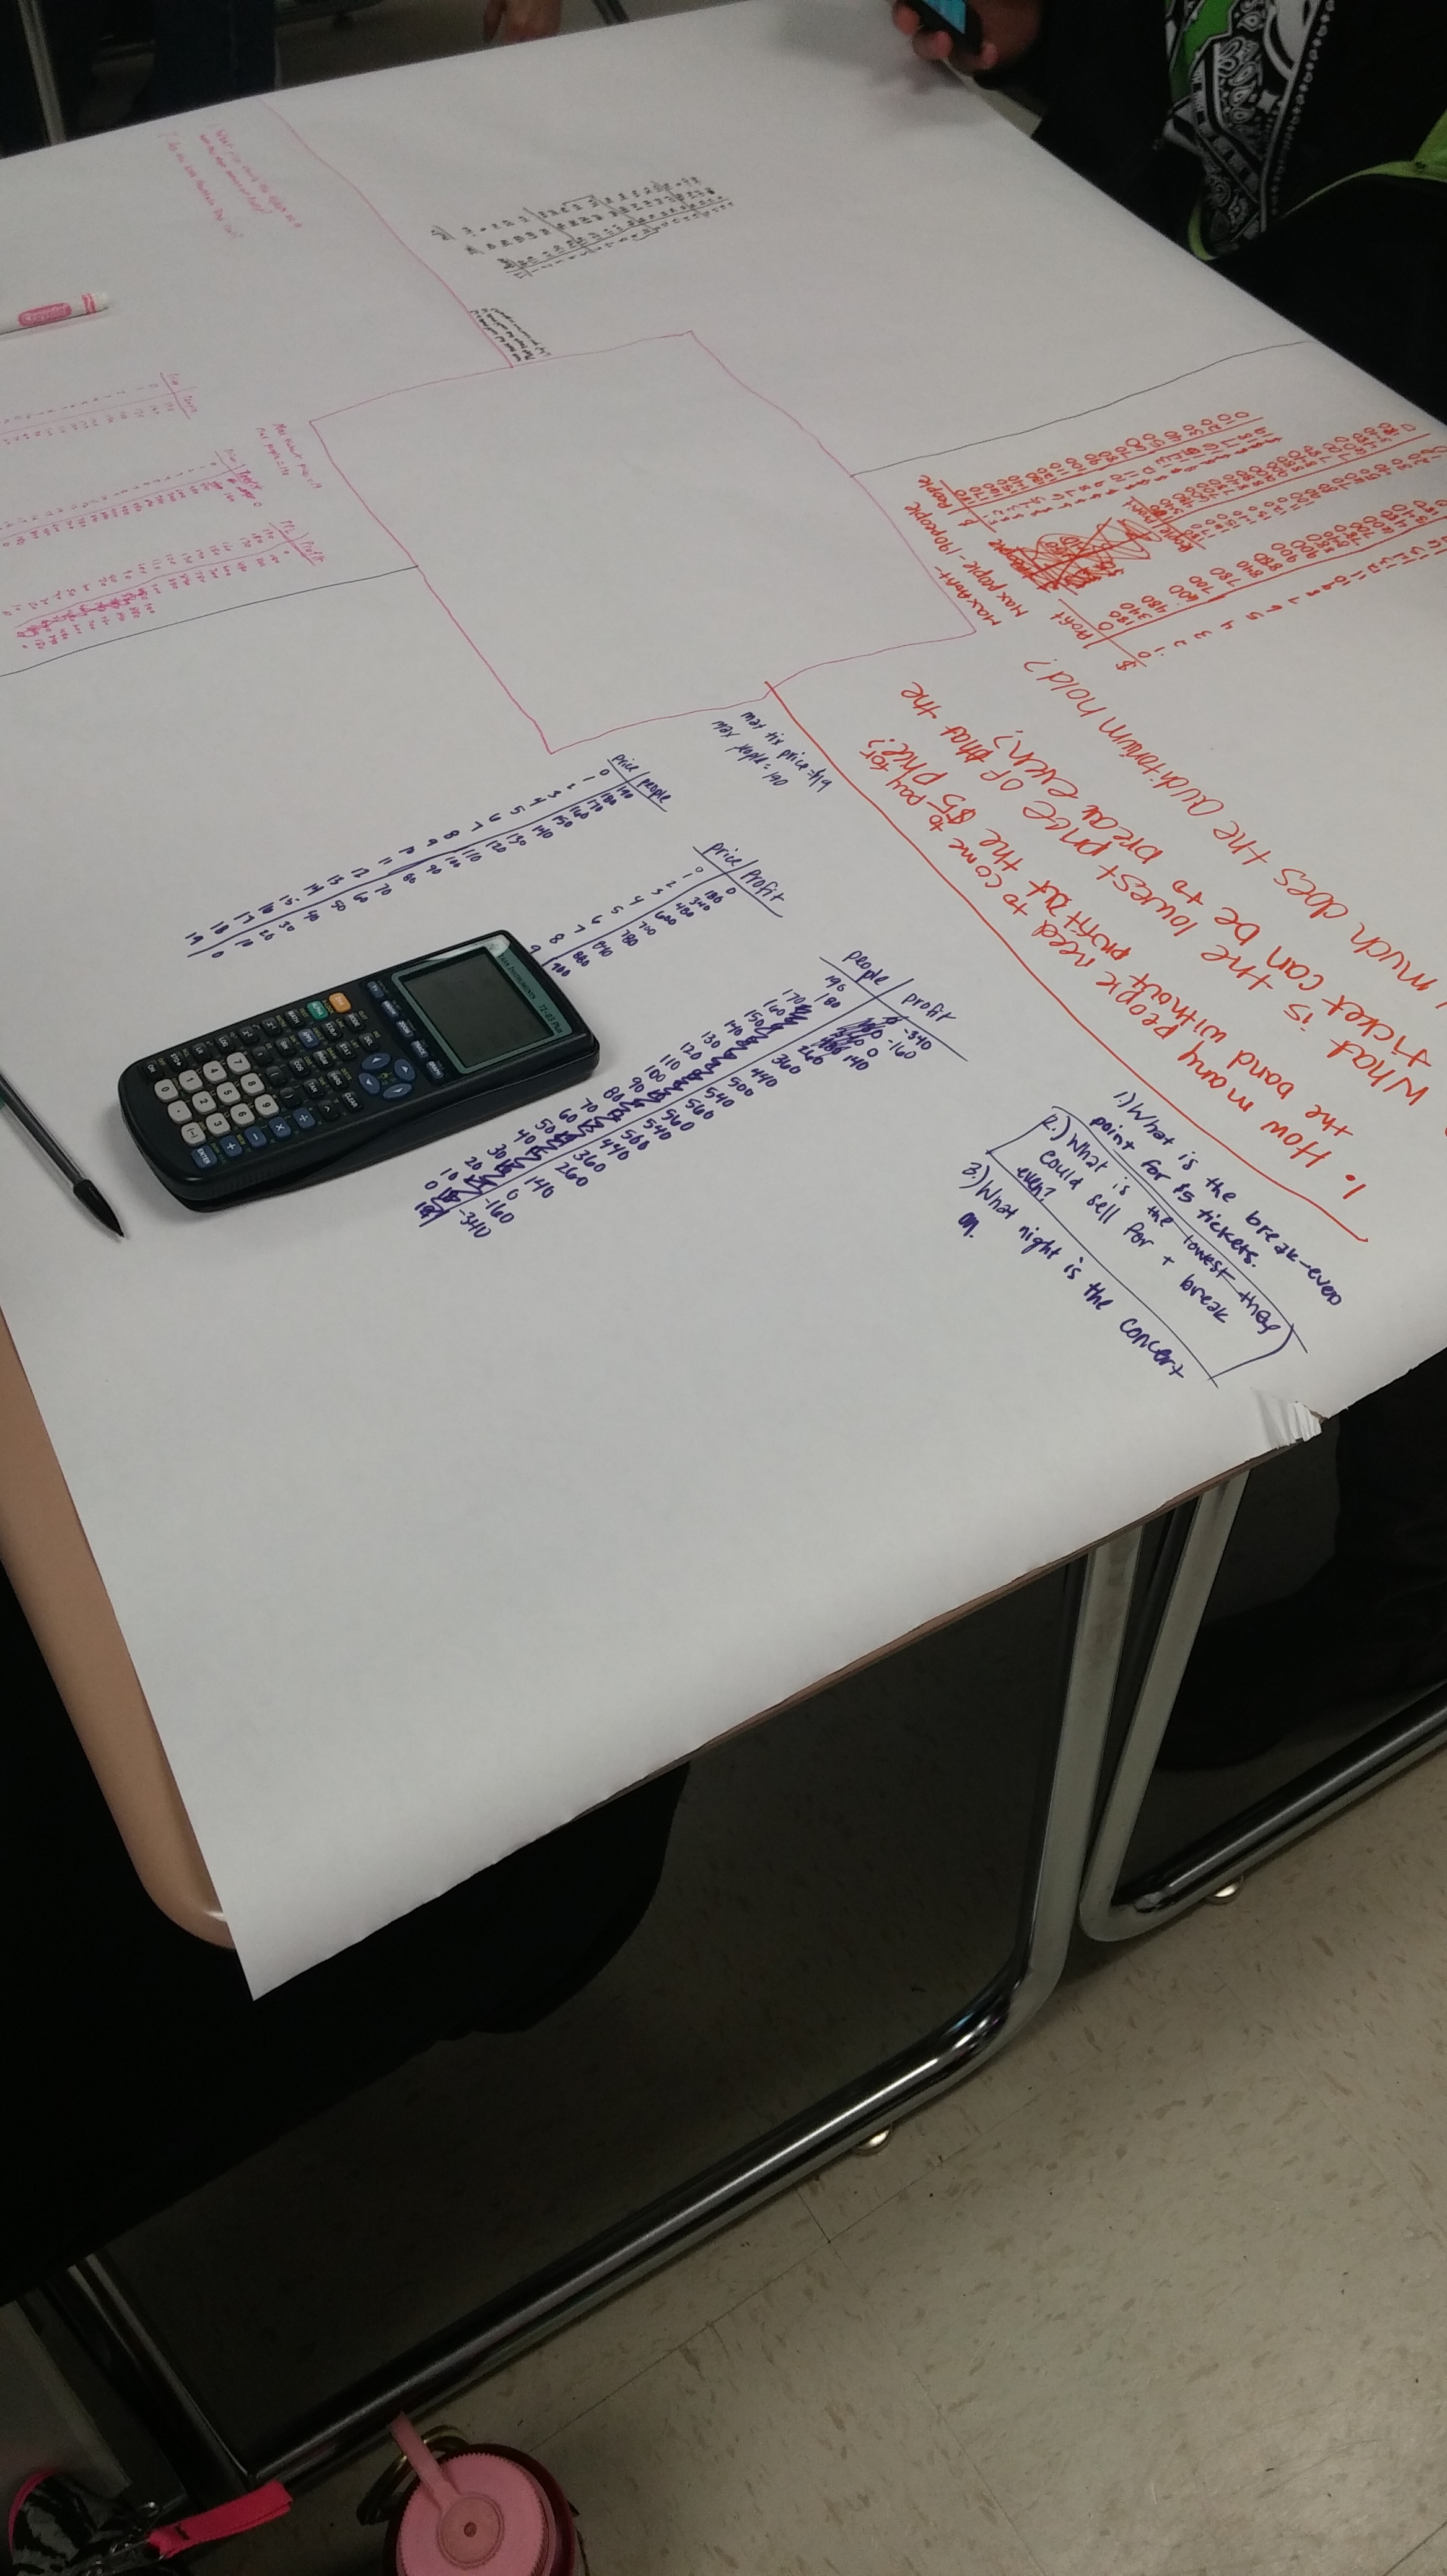
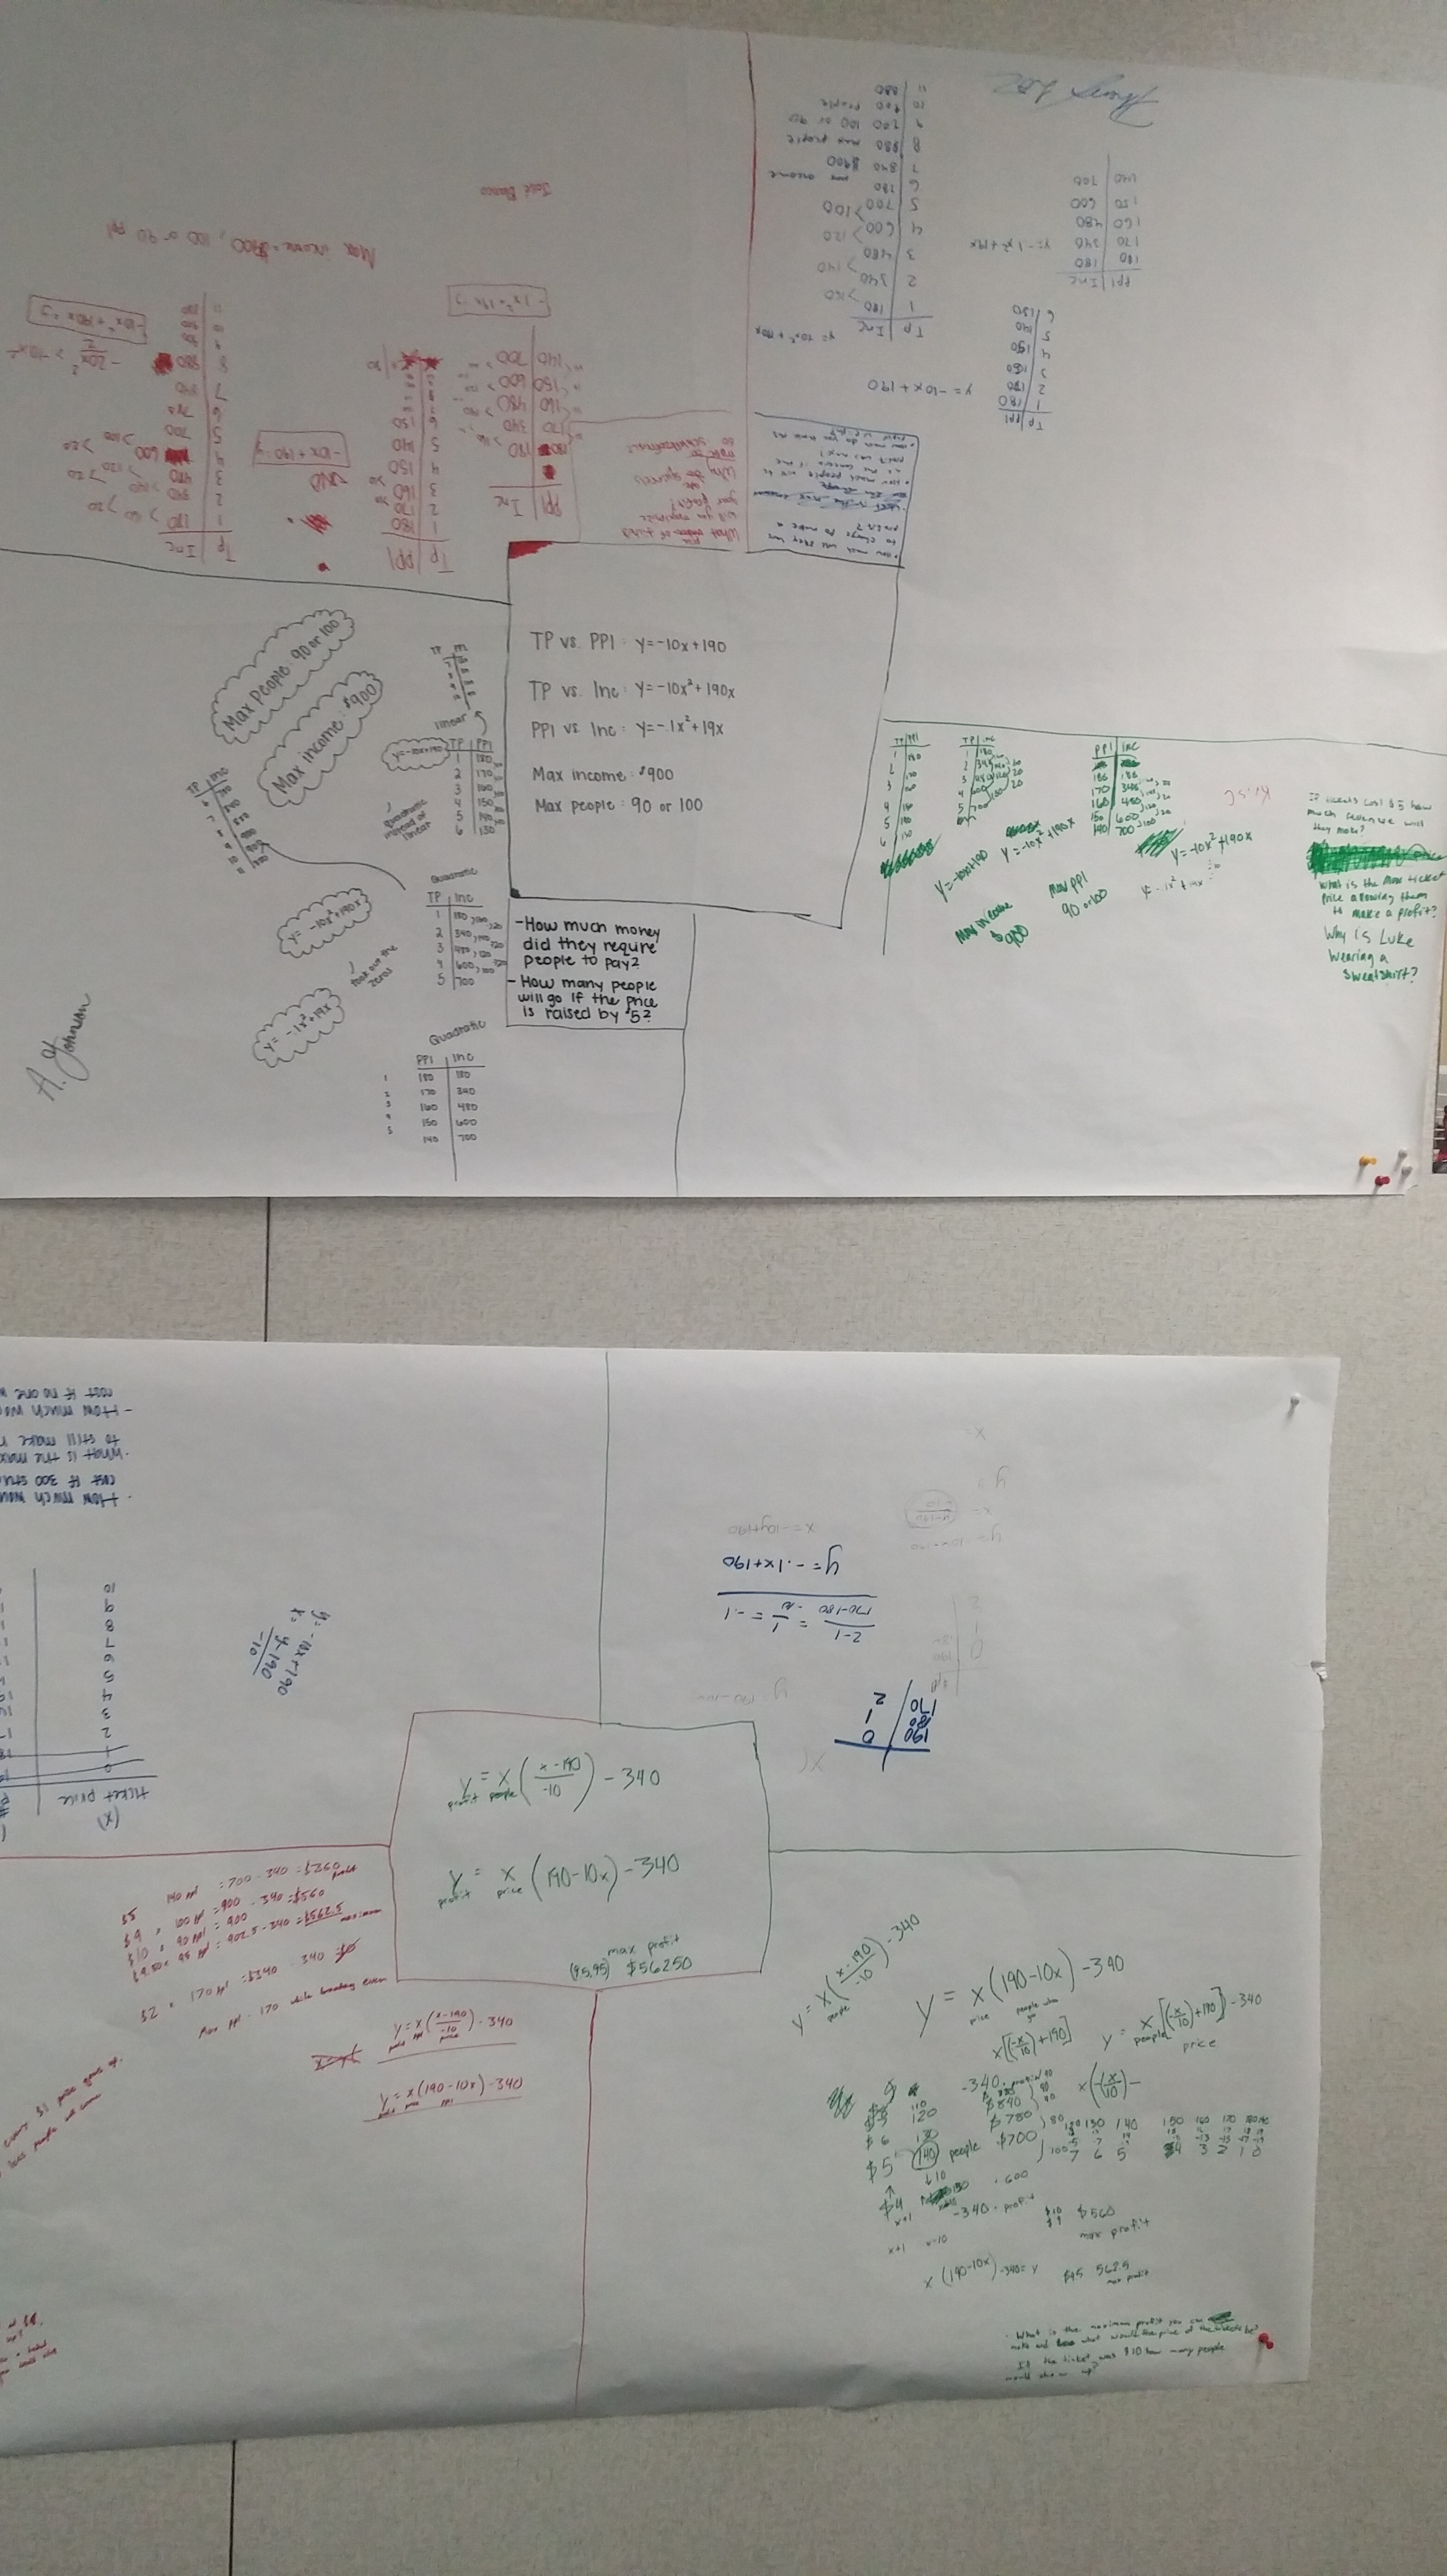
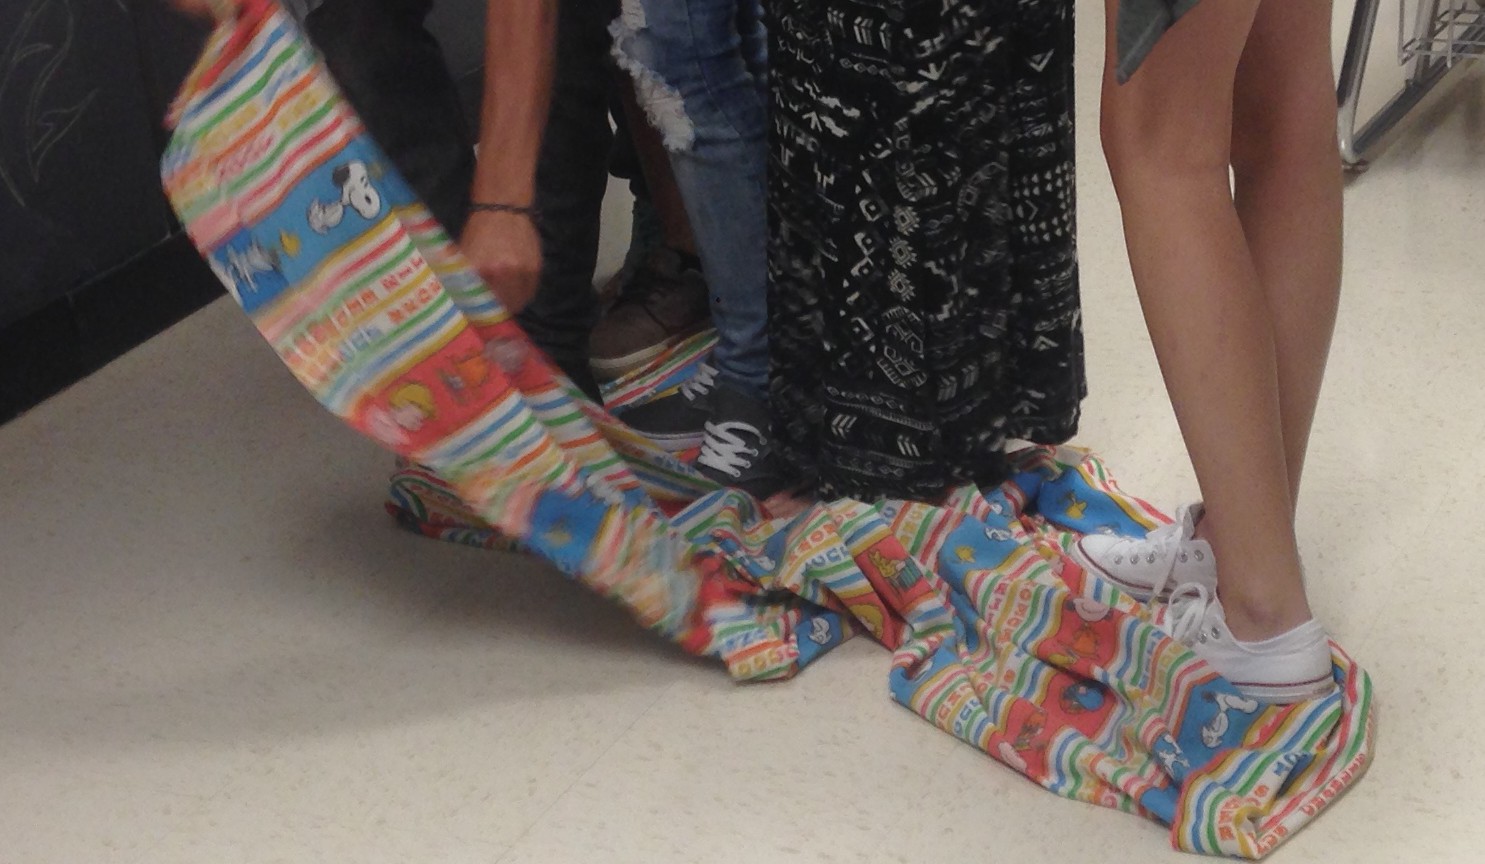
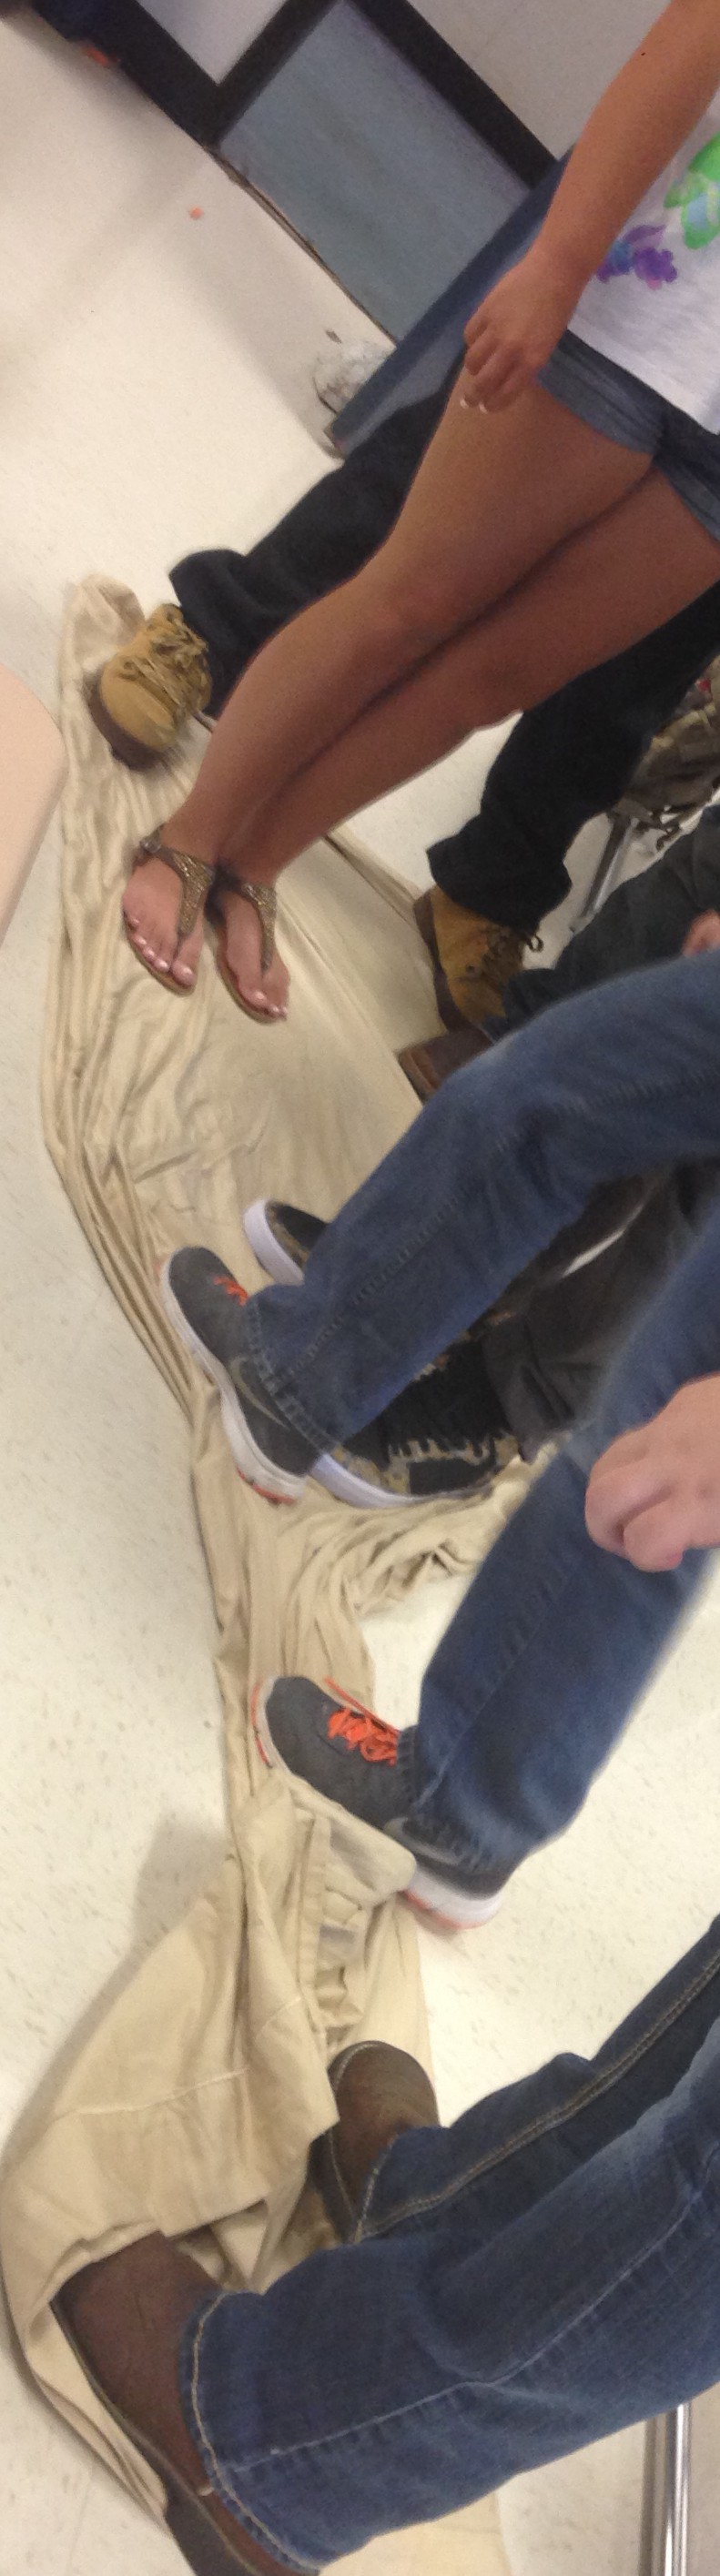
I then had them make posters including how it is growing, what the 10th, 100th, 0th, and -1st cases would look like, table, graph, expression, and relationship to the pattern.  Instead of one large poster, they use 4 smaller pieces of paper and tape them together.  That way each group member can contribute simultaneously.

I noticed:

  • It is difficult for students to describe how an irregular shape is growing.
  • It is even more difficult for them to describe something abstract like the -1 case.
  • Many of them expressed the overall growth as “exponential.”
  • Most could easily see the two rectangles formed and determine the dimensions with respect to “n.”

I wondered:

  • If they could connect the work with patterns to other quadratics.
  • How to have a meaningful discussion around the “exponential growth” issue.

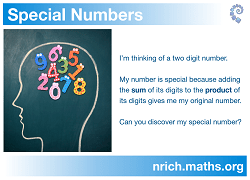
Their homework was to answer similar questions for this pattern from You Cubed’s Week of Inspirational Math:

growing

Spoiler alert: the rule for the pattern is f(n) = (x + 1)^2 or f(n) = x^2 + 2x + 1

So where do we go from here, two days before Winter Break?  My goals are to review some specifics on quadratic functions and simultaneously help the students make connections between different representations.  I know what I must do.  I must channel my inner Triangleman.

[Backstory:  Christopher Danielson and I go way back. At least to 2014. Maybe even 2013.  Seriously though, I strive to organize my college algebra class the way Professor Danielson describes in his blog.  I have picked his brain on more than a few occasions and he is gracious enough to give me advice in certain curricular areas. In short, his philosophy titled “They’ll Need it for Calculus” is the foundation of my College Algebra course. ]

Ok, back to room C118.

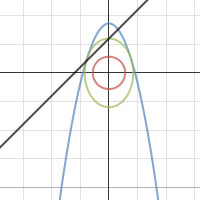
Me: Write down everything you know about the function y = (x+1)^2

(Most write down the expanded form, some start to graph, but not many)

Me: What other ways can we represent this function?

Students: Tables! Graphs! Pictures! Words! Patterns! Licorice!

Me: Sweet!  Let’s do all of that, minus the Licorice.

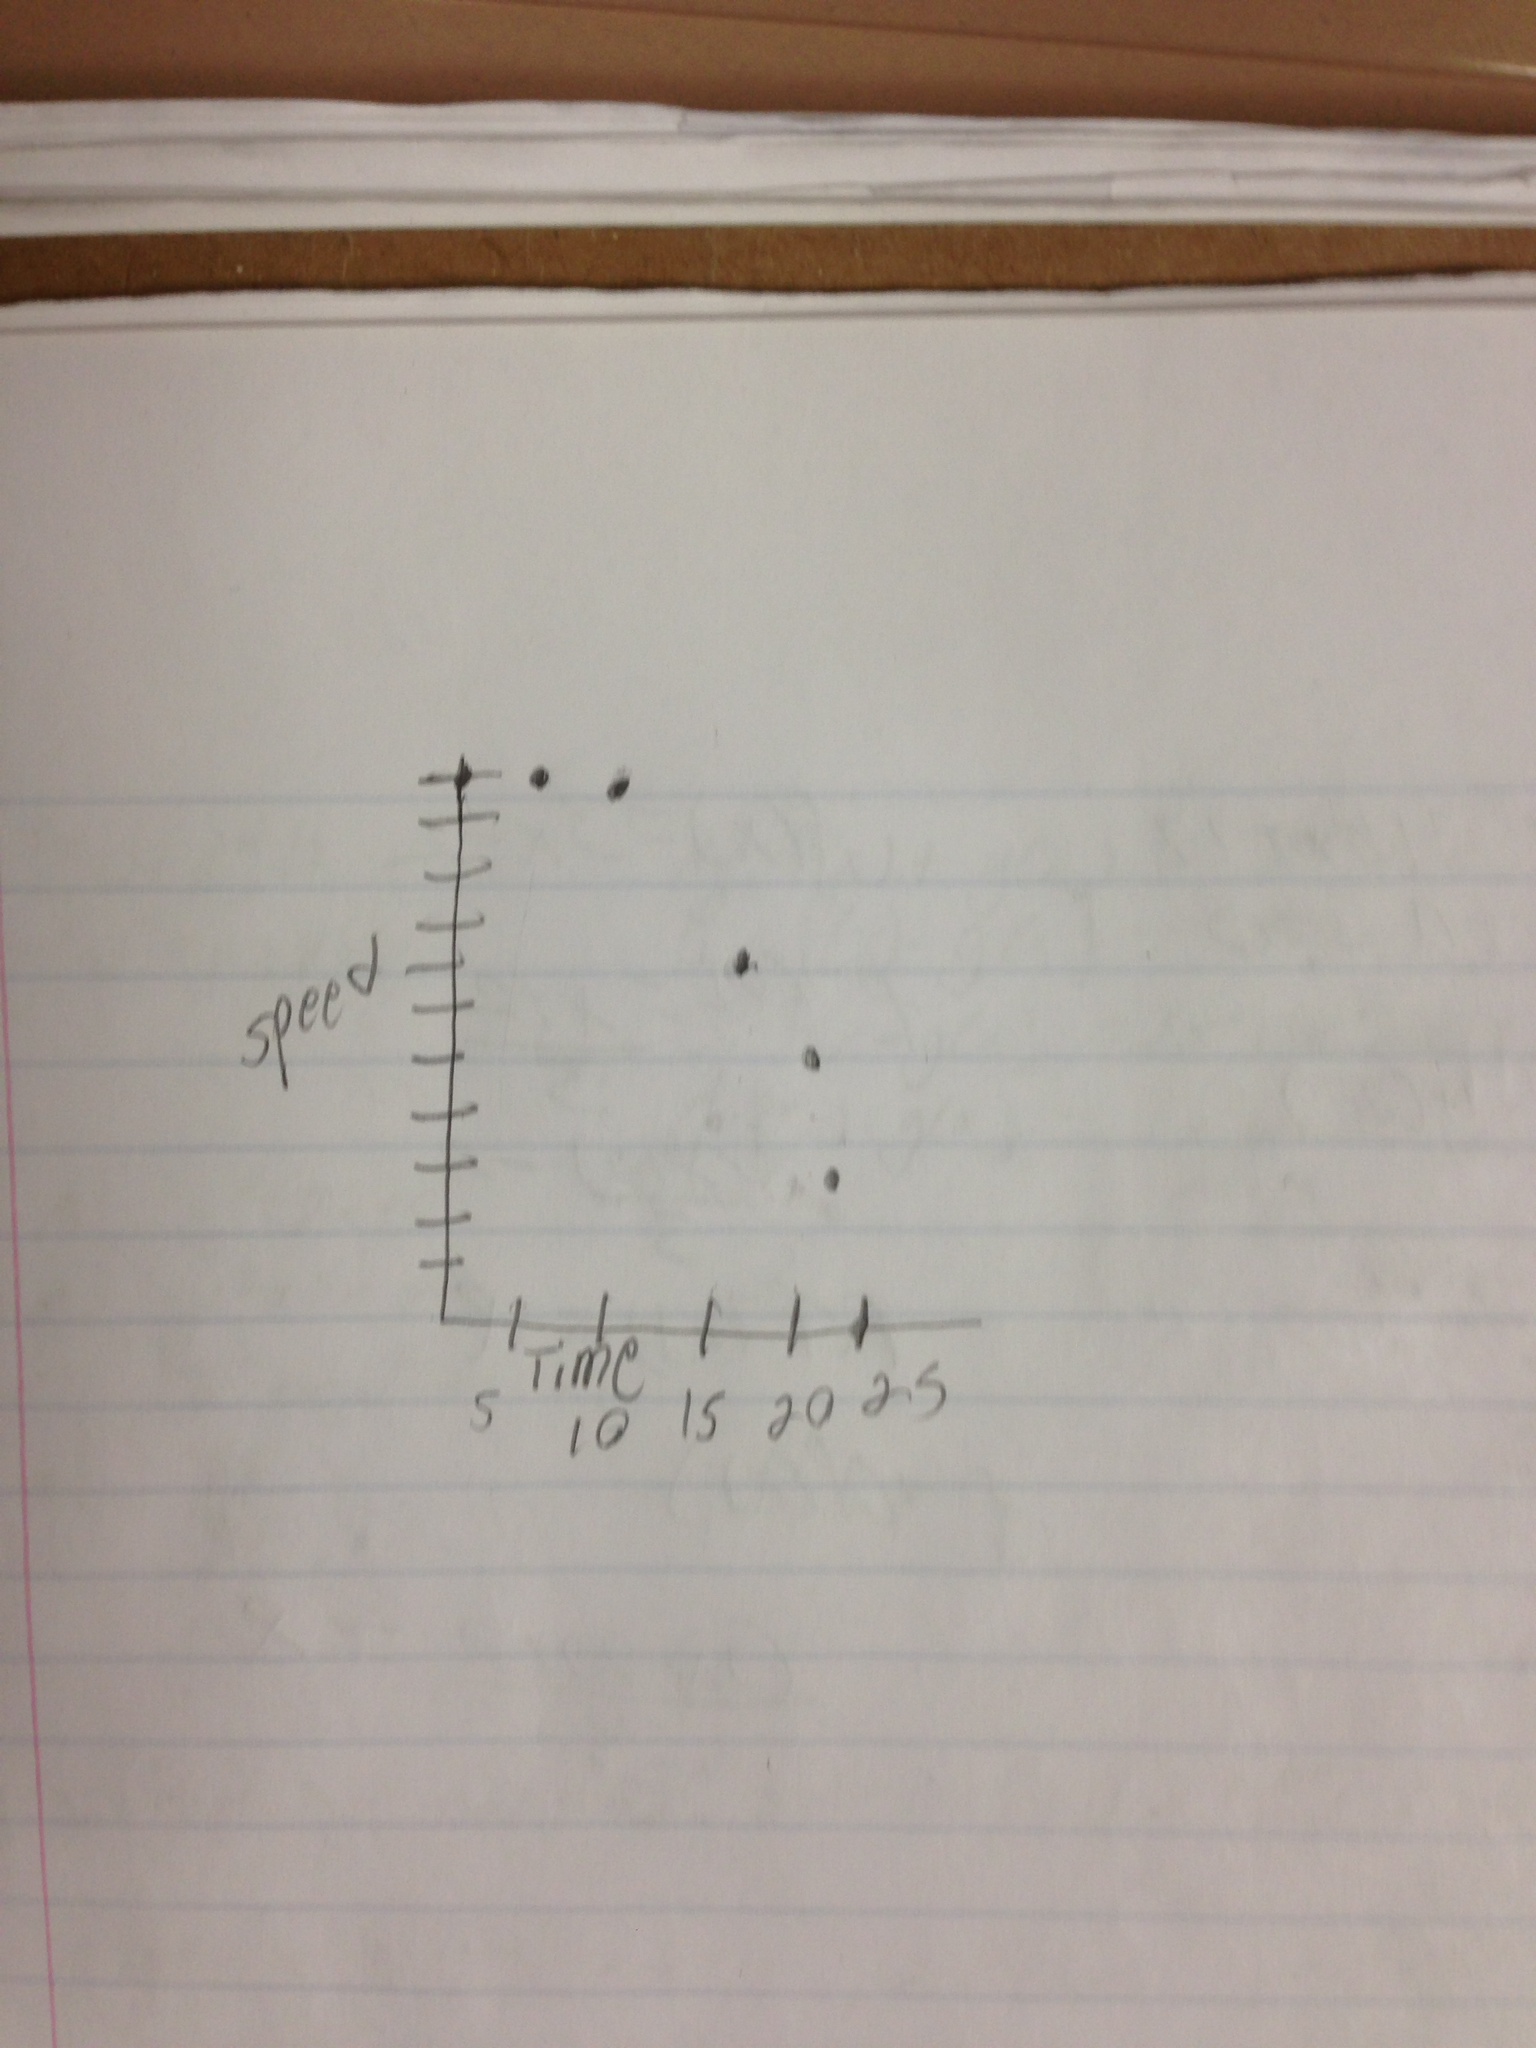
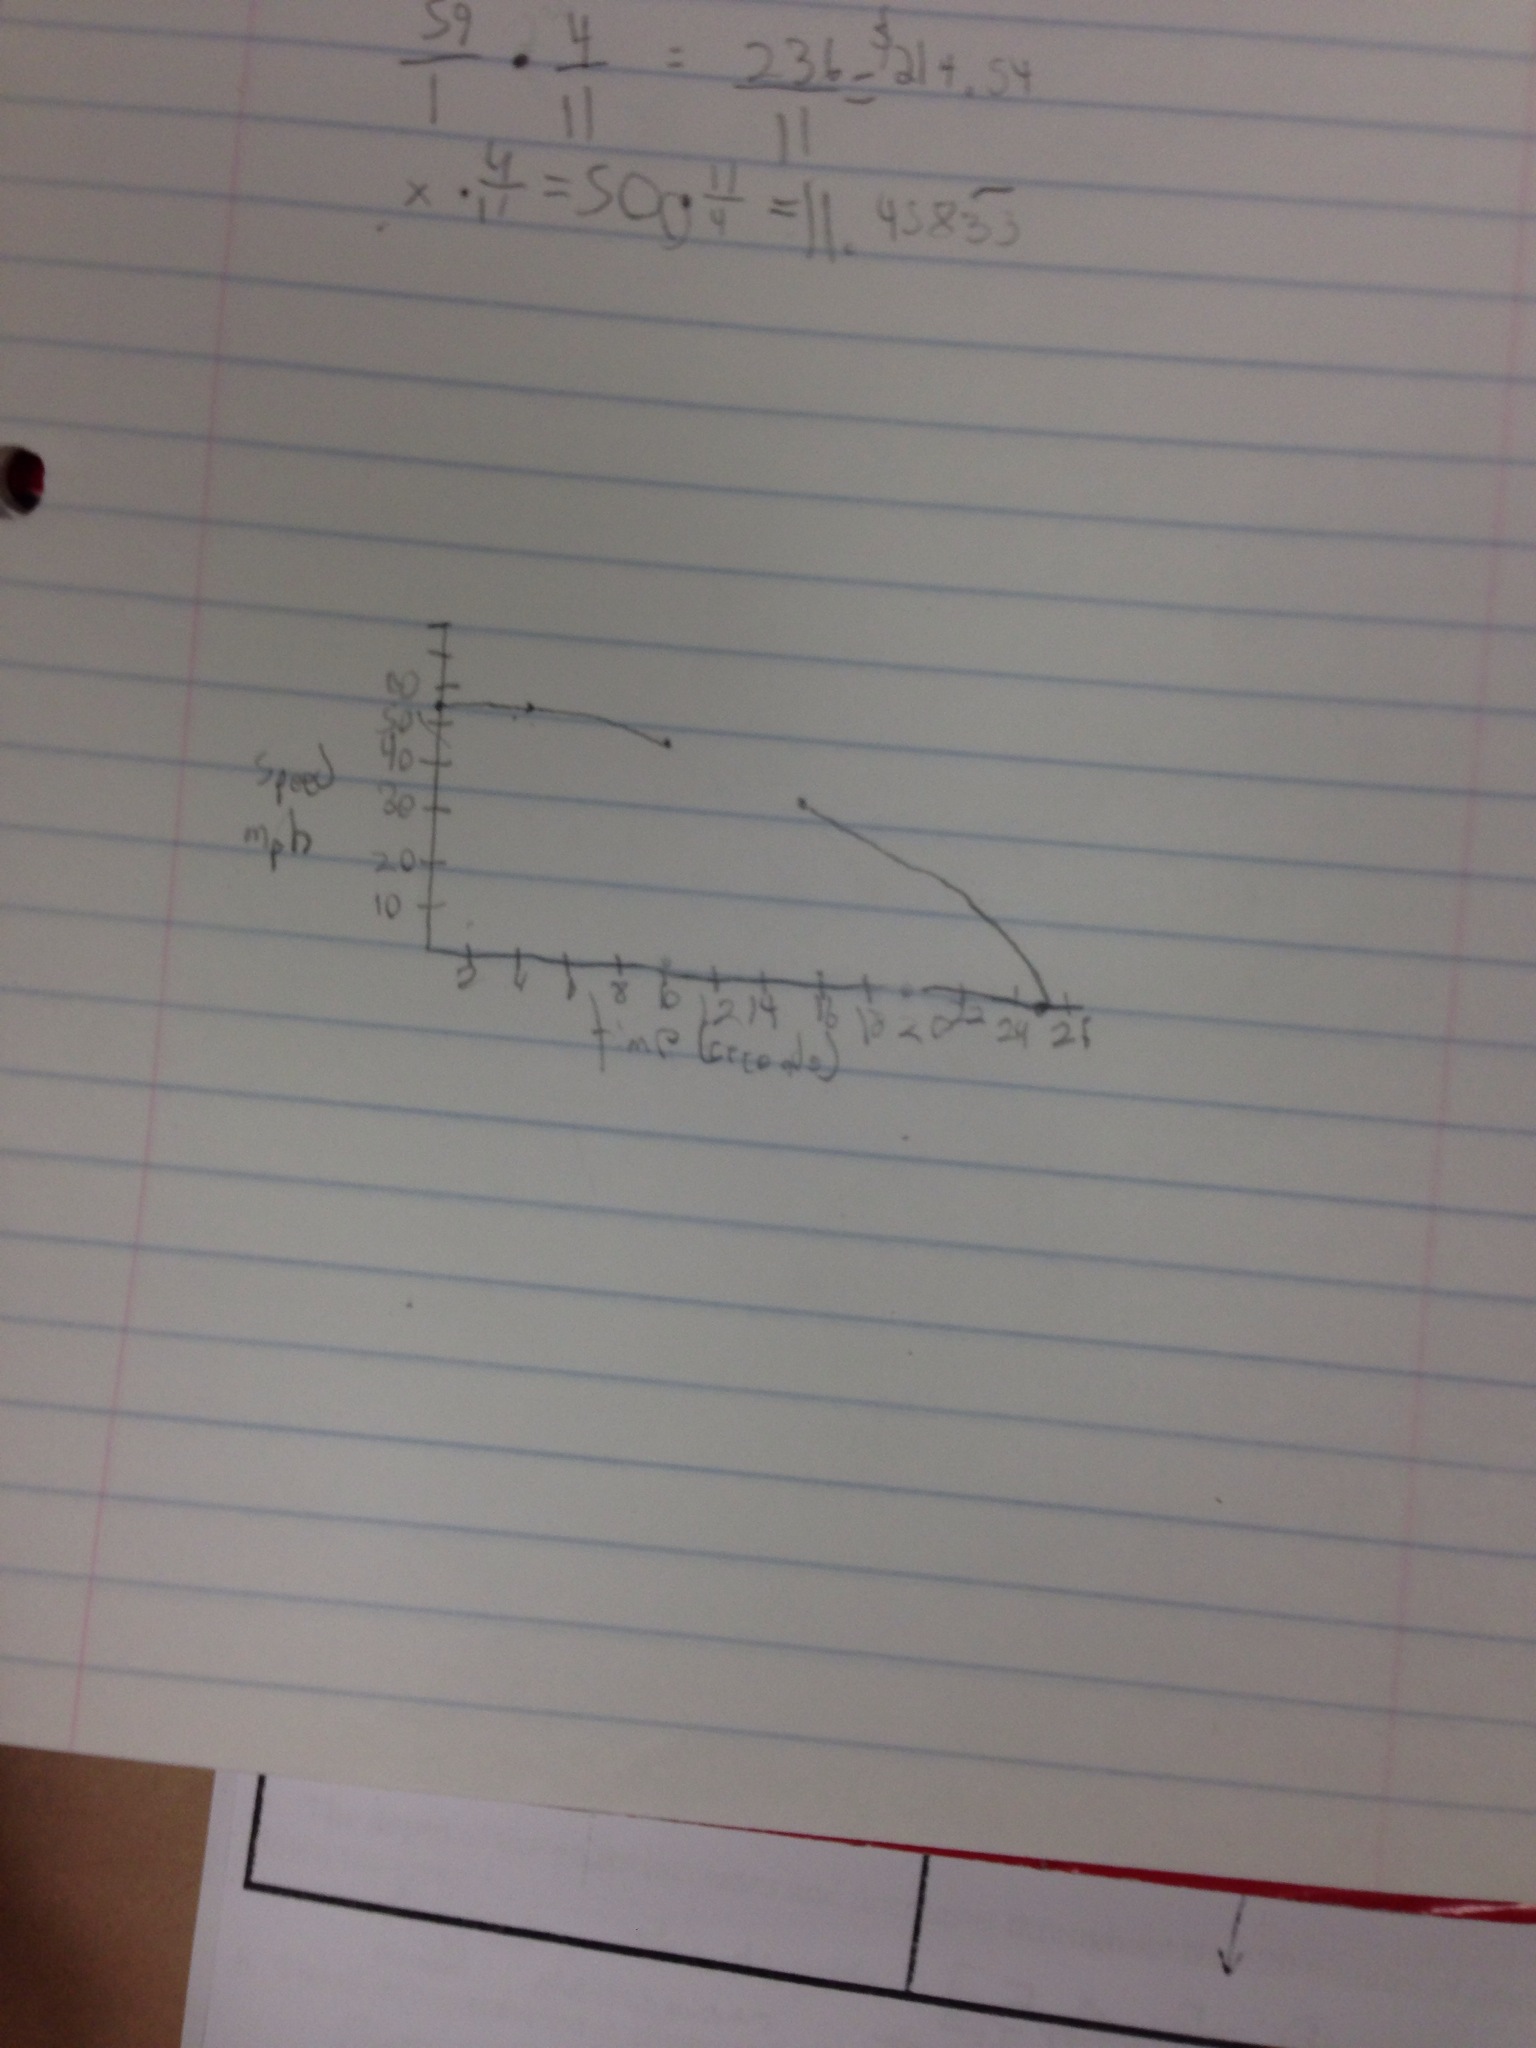
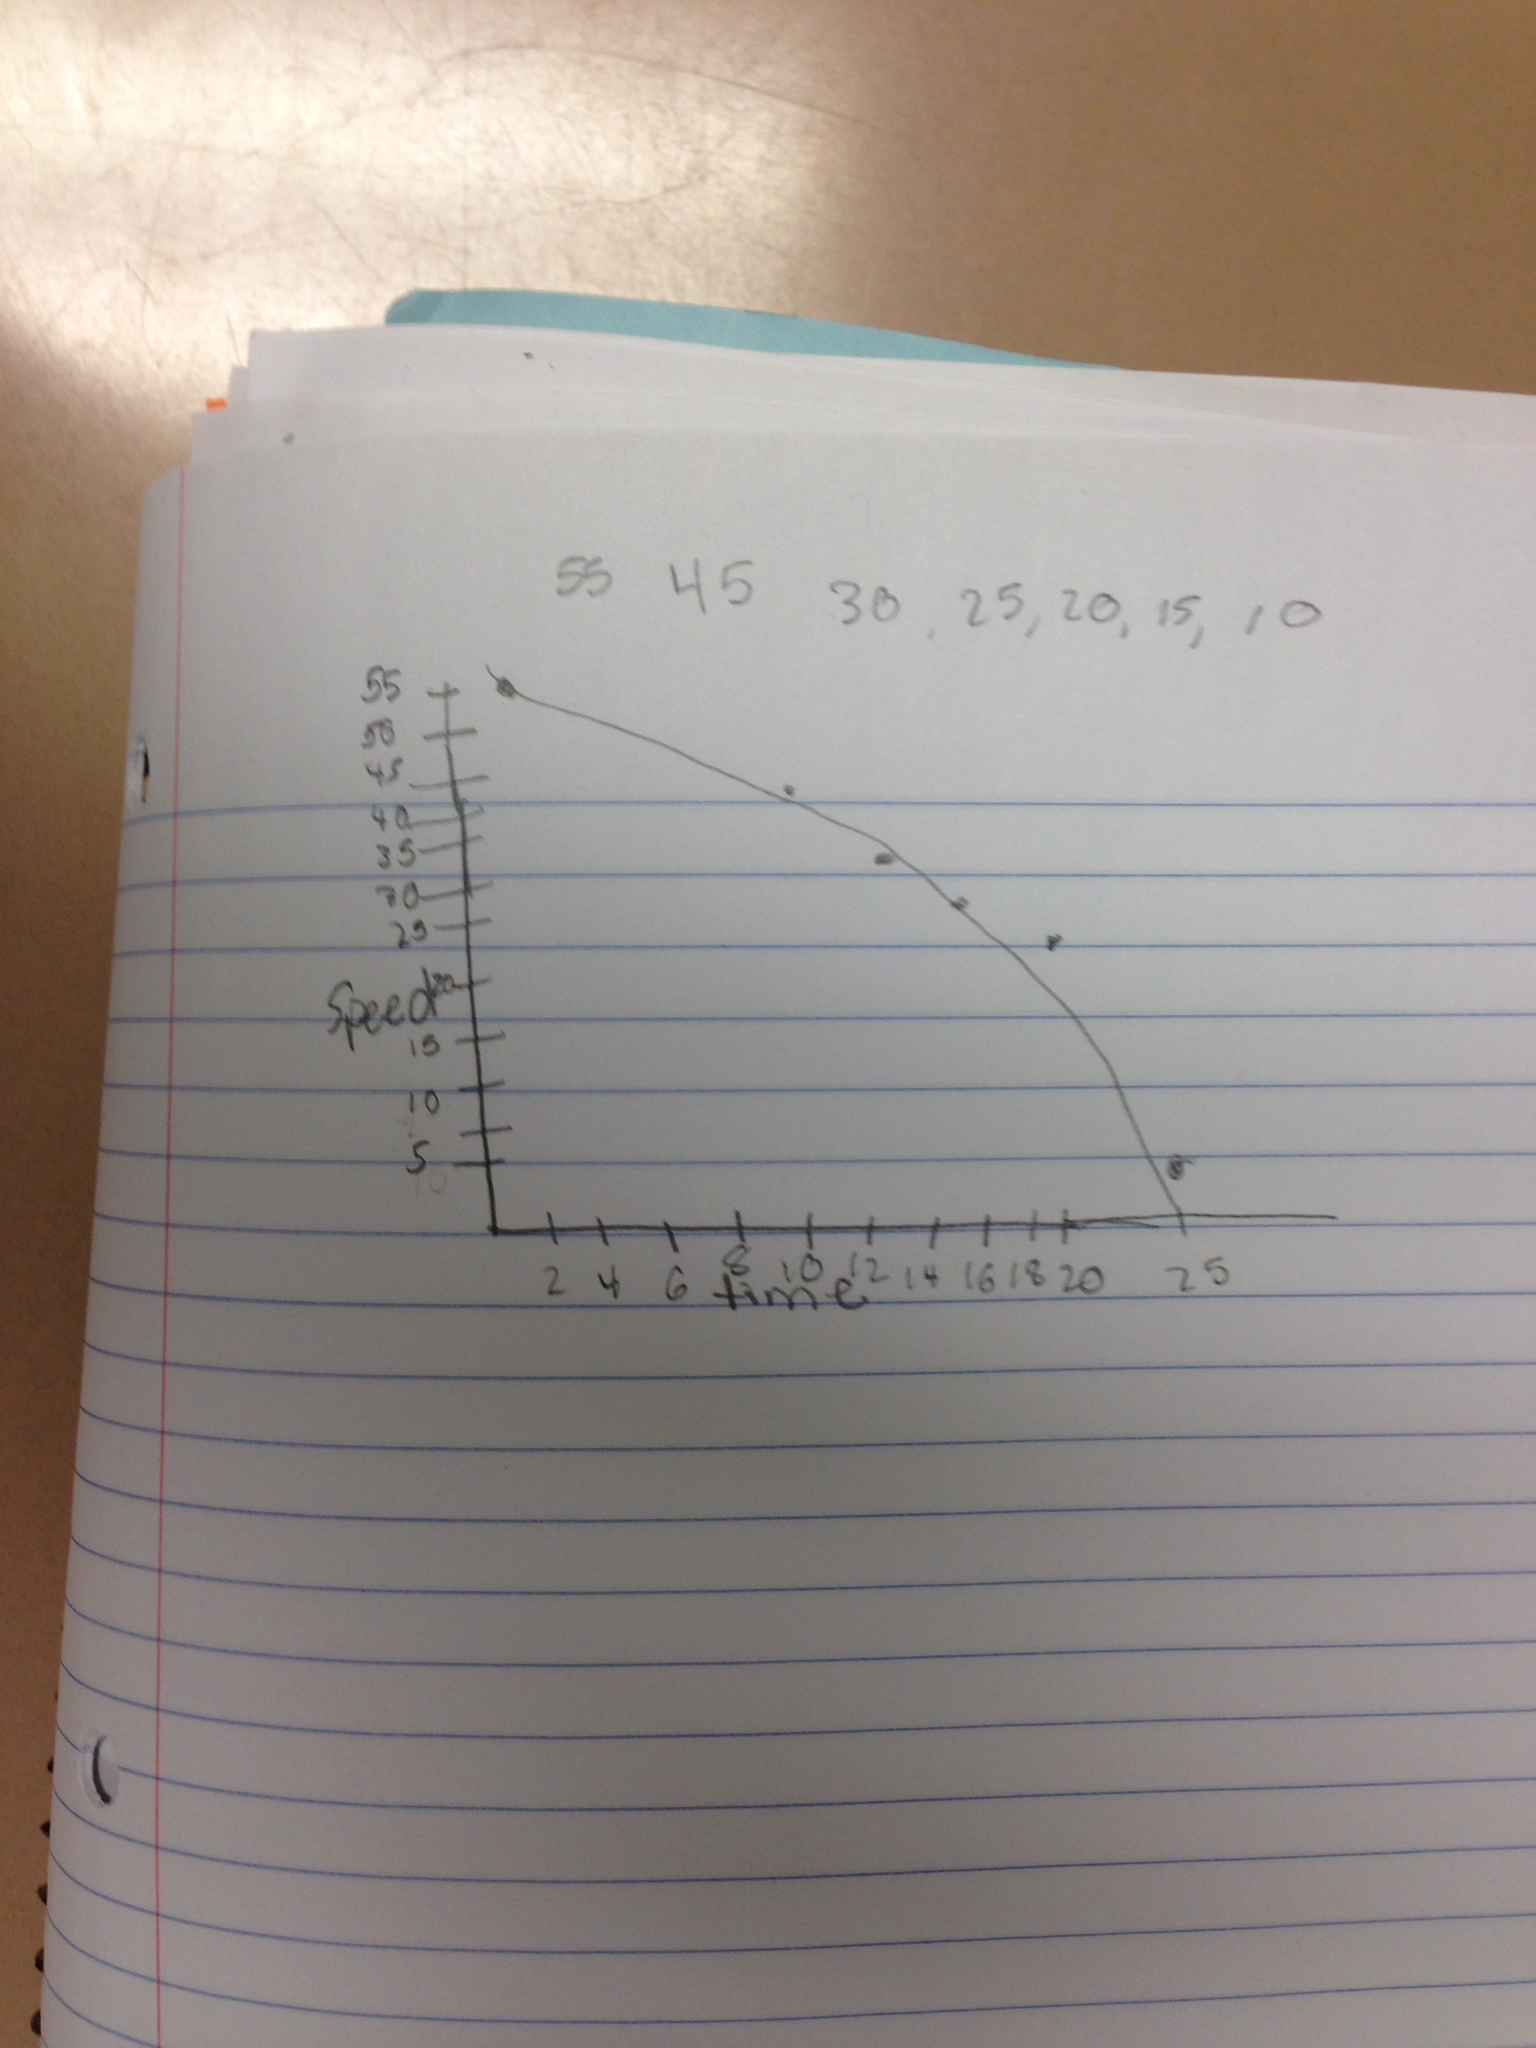
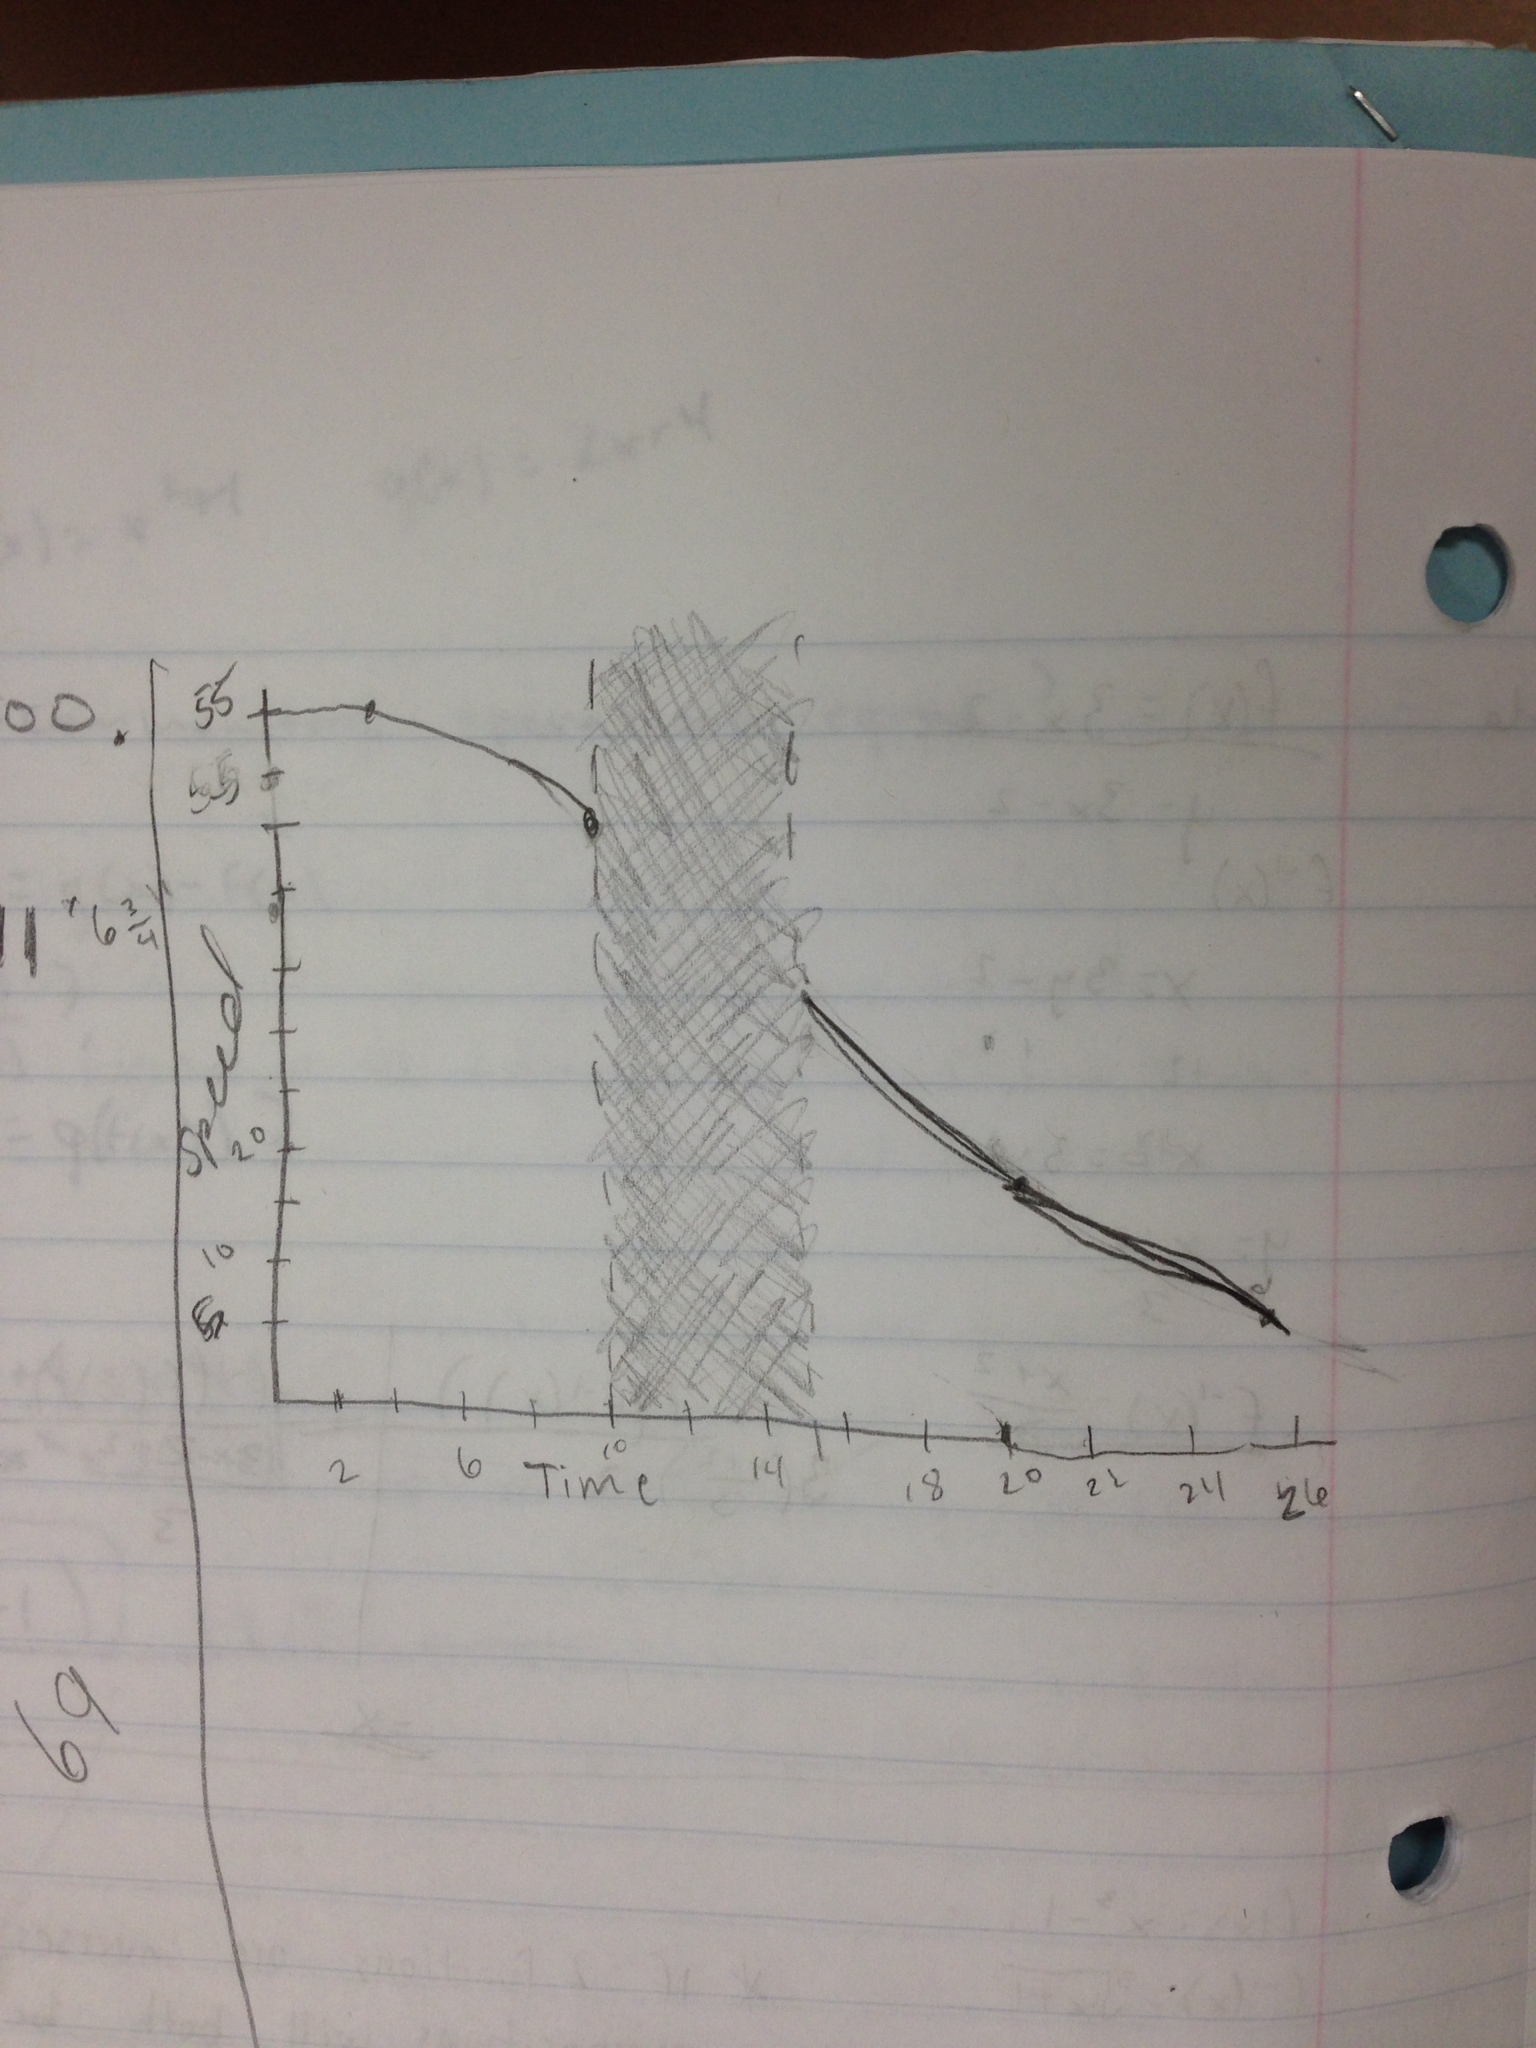
(I give them a few minutes to create a table and a graph.)

Me: NOW, write down everything you know about this function.

I circulate and hand each group a half sheet of paper.

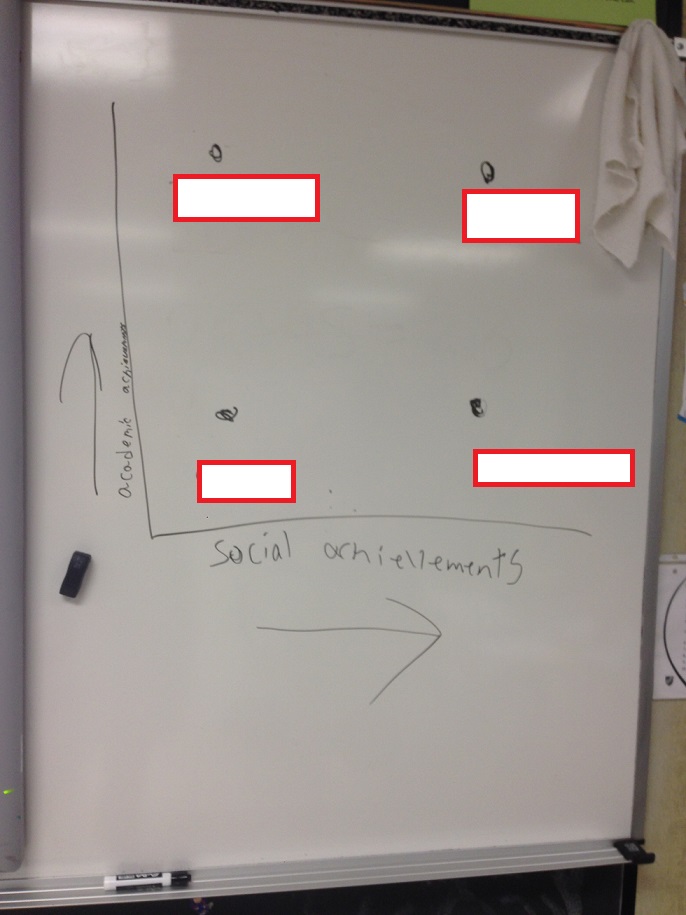
Me: Write down the most important thing on your groups list.

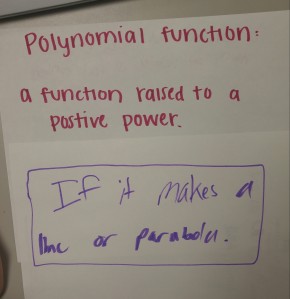
At first I wasn’t really concerned what exactly they wrote down, but how they defended their choice. Then I came across this in all of my classes:

1223151442-1.jpg

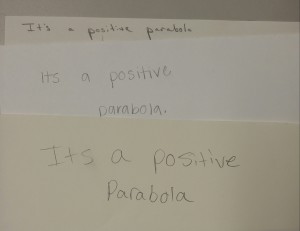
We came up with a pleasing list of attributes of a positive parabola that included vertex placement, end behavior, leading coefficients, and rate of change.

Next up for discussion: Parabolas grow exponentially.

Me: Turn to your partner and tell them whether you agree or disagree with this statement and defend your choice.

Students: Yes, words, words, words.

Me: Ok, now the other partner, say how you know something grows exponentially.

Students: Multiplied every time, more words, blah blah blah.

So we agreed that 2, 4, 8, 16, 32, 64… is an example of something that grows exponentially.

Me: Numerically, how can we tell how something is growing?

Students: (eventually) Rate of Change!

We came up with this table and agreed that these two functions were definitely NOT growing in a similar way.

1224151308-1.jpg

Now on to helping them understand what it means for something to grow quadratically…


Nrich-ing New School Year

I have made no secret of my unwavering devotion to Nrich.  This University of Cambridge-based website is a treasure trove of rich tasks.  The best part about this website is the ability to engage students with abstract algebra concepts.  Very infrequently does Nrich apply their problems to any real-world concept.  They let the arithmetic itself set the hook.  And the algebra solidifies the concept.

Example:

Special

As a bonus, now that school is underway, they have many “live” problems which are open for class submission.  I’m hoping that my class might want to submit solutions for the Puzzling Place Value problem.

There are a lot of great problems here that I’ve used in my classes.  The only problem with available new problems is now I want to devote all my time to solving and implementing them!


Math is Messy. So Are Gender Roles.

I have been absolutely humbled by all of the positive feedback I have received from my previous post.  Thank you to infinity for taking the time to read, write, and share.  I believe that it is our common humanity that makes it possible for us to learn from one another, not necessarily our knowledge of content.  There is so much of my sobriety that goes into my teaching.  It is an incredibly freeing feeling to be able to be honest about that part of my life as I blog.

Rose Eveleth wrote a great piece about the roles that girls find themselves taking on in group work.  In short, Eveleth focuses on acknowledging that girls often self-assign the “recording” role, absolving (and downright excluding) themselves from a problem solving opportunity.  The end result, career-wise, may lead women away from high-profiled positions.   As teachers, it’s easy for us to overlook this discrepancy because girls, generally speaking, are neater and more organized, and may seem like the best fit for the job.  In a related article, Dale Baker does a great job of asking teachers to examine gender preferences that exist in our classrooms in order to help encourage all students to step into the “lime light.”

On Friday, I tried a simple version of this.  First, students were presented this scenario (taken from the Math Forum POW section):

The Student Council at Rahkenrole High School is planning a concert.  They’ve hired the Knox Mountain Boys, a popular local band, for $340.  A poll among the students has shown that if tickets cost $5, 140 people will come to the concert.  For every dollar the ticket price goes up, 10 fewer people will come, and for every dollar it goes down, 10 more people will come.  

I’ve been a huge fan of the Math Forum, long before I joined Twitter (and got to fangirl Max Ray at TMC14).  The reasons might not seem obvious from this scenario, but kids noticed right away that there was no question asked at the end.  What’s brilliant here is that there is literally an infinite number of questions that we could ask here.  Granted, some questions are more important than others, but I framed the task in a way that elicited what I needed.

I handed out a big white piece of paper to each group of 4 and had them divide the paper up into sections.  This way each person in the group was both the recorder and the problem solver.   I asked them to write down 2 questions they think that I would ask about the scenario and one question (anything) that they would ask.  They identified their group’s most important question and put it up on the whiteboards on the wall.

Low and Behold!  They READ MY MIND! They asked about maximizing profit, income, and people, and also requested modeling equations for each.  The excellence in this scenario (and the Math Forum in general) is that it can be applied to so many levels of math for so many reasons.  For example, most high school kids can make a table and figure out a reasonable answer for the maximization questions, and kids with more know-how can develop mathematical models.

Some great things happened:

  1. They knew they needed ONE set of answers in the center of their paper.  This meant they had to communicate the work in their section. The traditional group roles dissipated, and they all had equal stake in solving the problem.
  2. They solved the problem in so many different ways.  (Do you remember these types of questions from Algebra 1/2?  I’m sure they have a trendy textbook label that alludes me at the moment. But they are solved by making the variable “number of price increases. Interestingly, very few students solved it that way successfully.)
  3. They were messy. And I loved it.  In fact, I made the second class use markers exclusively so that they could not erase.
  4. They were uncomfortable leaving some of the questions unanswered.  When I didn’t label certain questions as “bonus” or “extension” they felt that all were necessary to be successful.  My goal was for them to collaborate with ownership in their individual contribution.  I may have gotten more joy out of this part than I should have 🙂

Here are some fun photos of their work:

0109151104-1 0109151149 0109151215


A Twist on Old Venn

How many of you went nuts over the Google Doodle for John Venn’s 180th Birthday?  I have no shame in admitting I spent more than a few minutes messing around with it.

These not-so-modern overlapping circles of wonder have fascinated mathematicians, scientists, and even linguists alike.  When searching for rich tasks for my college algebra classes, I came across this new twist on the traditional Venn diagram:

FullSizeRender

This activity can be applied to all kinds of topics with the main task being to find an equation to fit into all eight of the Venn diagram regions.  Since we are working with systems of equations, I offered this challenge to my classes:

Can you find three graphs that all intersect and also each intersect one another at unique points?  Also, is there a 4th graph that does not intersect the first three?  

0923141345-1

Out came the iPads and Desmos.  Here are a few highlights:

unnamed (1) unnamed (2) unnamed (3) unnamed (4) unnamedunnamed (5)

Some of my observations during their work time:

  • A few of them assumed we were creating an actual Venn Diagram with Desmos. I made sure the expectation was more clear the next period.
  • Attention to precision was important.  Some students assumed that if the three graphs appeared to cross one another, their task was complete.  They were mistaken when I zoomed in to examine the intersection points.
  • Students assumed that if a graph did not intersect another in their viewing window, it didn’t intersect at all.  We had some good conversation about where graphs might cross as the x and y approached infinity.
  • Using sliders in Desmos makes this task more doable in one class period.
  • I wonder if they would be able to solve for their intersection points algebraically.

Side note:  these RISPs (Rich Starting Points created by Jonny Griffiths) are all available on this website, and are excellent starters for college level mathematics.  

Sitting in a Circle, Talking about Numbers

“I feel like all we do is sit in a circle and talk about numbers.   It doesn’t even feel like work.”

“This class is more exhausting than my PE class!”

“It’s nice to be confused and then un-confuse ourselves.”

These are words I’ve overheard from my college algebra students this year.  I couldn’t be more pleased with the strides they are making with my problem-solving framework.  I learned the hard way last year that you cannot just throw a problem solving scenario at a student and expect them to immediately persevere, even if they understand the underlying mathematics involved.  Having learned from my mistake, I sequenced the problems this year in a way that has worked to build on their Algebra problem-solving skills.  Furthermore, I’ve put them in groups of 3-4, which has helped tremendously in getting them to talk about their approaches.  Last year, while in pairs, the conversations didn’t occur as naturally as I had hoped.    Here are a few of the problems we’ve tried:

Multiplication Square C thumb (1) thumb


Additionally, we’ve used other Nrich problems such as Odds, Evens, and More Evens.

And to add some non-dairy whipped topping to this algebra awesomeness, my students are breezing through visual patterns and having some great conversations about them.  Credit here is due to their fabulous algebra 2 teachers who began visual patterns with them last year and let them struggle with them.  The result has been deeper connections and a more thorough understanding.


Facing Fear

It’s always fascinating to me to watch students step into a new classroom and immediately search for their social comfort zone.  Students aren’t unique in this phenomenon; they are just the group of humans in which I interact the most.  Today being the first day of school, the visible and invisible social boundaries that students draw between one another were clear as I silently observed.

As someone who struggled fitting into a unique social group growing up, I’m most interested in encouraging kids to break away from their cliques. After reading much of what Ilana Horn has written on the subject, I also began to see links between being socially extroverted and status in the mathematics classroom.  For example, kids who are quiet and mostly keep to themselves don’t often have opportunities to display their “smartness,” whereas an outgoing kid willing to contribute voluntarily to class discussion would have their “smartness showcased regularly.  Interestingly enough, when doing the “personality coordinates” activity with my college algebra class today, one group created this graph:  IMG_6508

They defined social achievements as number of friends and academic achievements as GPA.  It allowed us to have a nice discussion about grades and overall intelligence as well as some lovely talk regarding different definitions of social achievement. I look forward to continuing these conversations over the course of the trimester and challenging them to let their popularity guards down.

On a similar note, I tried the Blanket Challenge in my Algebra 2 class.  If you have not read this chapter in Powerful Problem Solving, I’m not sure why you are still sitting here.  Go read it! What impressed me with this group of kids, was they were willing to step out of physical comfort in order to achieve the result they wanted.  IMG_6505 IMG_6506

On the first day of school, in a class that’s tough to adjust to, I can’t begin to express how proud I am of this group of kids for their willingness to work together respectfully and successfully.  I’m hoping to build on the results from this activity in the days to come.

A Speedy Makeover for the Intermediate Value Theorem

As a college algebra teacher, I was not satisfied with the way I presented the intermediate value theorem last trimester.  I felt the lesson was somewhat isolated from other concepts we had studied and definitely was disconnected from the real world.  My approach lacked a hook and was laddened with procedure.   Committed to teaching the concept better this trimester, I recorded the following video while (someone else) was driving:

I know, not a high quality masterpiece, but I think I captured what I needed to illustrate the theorem.

I ask the students to draw a graph of the speed of the car with respect to time.  After playing the video a number of times, I had them share their graphs with their seat partner.  As I circulated the room, I noticed their results fell into one of these three categories:

Graph A

Graph A


Graph B

Graph B


Graph C

Graph C

After examining the options, I had them choose which graph they felt represented the situation most accurately.  Spoiler Alert:  The overwhelming majority of them chose Graph B.  Their reasoning:  it’s unclear what happened to the speed between seconds 10 and 15 therefore, there should be a space in the graph.  Those vying for Graph C cleverly argued that there was no audible “revving of the engine,” indicating that the car continued to slow.  Others supporting C claimed that even though we could not see the speed, they know how a speedometer works and can make a reasonable assumption about what happened in that time frame.

Enter this student’s graph and the Intermediate Value Theorem (trumpets):

IVT graph

I liked this students “shading” through unknown speed region, so I projected it for everyone to discuss.  They were able to determine the value of the function at ten seconds, f(10), was approximately 45 miles per hour and the value of the function at fifteen seconds, f(15), was approximately 35 miles per hour.  They also knew that the car must have reached 40 miles per hour sometime in between 10 and 15 seconds.  “How do you know that?” I pryed.  Gem response of the day:  “Well, speed is continuous and I can’t go from 45 mph to 35 mph without going through 44, 43, 42, 41, 40 mph, and so on.”  Bingo.  Intermediate Value Theorem.  No boring procedural explanation necessary.

We applied this “new” knowledge to a polynomial function so that they could get a handle on some of the algebra and notation used.   And as a bonus, they also seemed to grasp that this theorem does not only apply to crossing the x-axis, a common misconception students had last trimester.

Moving forward, I’ll definitely work on creating a better video!

Surgery for Function Operations

My college algebra course boasts one of the driest textbooks on the planet. It’s one of those versions that has exercises from 1 to 99 for each section…brutal.   Can you relate?
The topics for college algebra are very standard and cover little more than what students should have encountered recently in their algebra 2 course. I therefore decided that this class would lend itself quite nicely testing out the theory that a high-level, rich question questioning can be facilitated from a traditional, drill-and-kill style textbook.

Previously, I recall that Operations on Functions was a particularly awful topic for both me and my students.  The textbook presents this concept in exactly the way you might think:

f(x) = [expression involving x]  and g(x) = [similar expression involving x]

Find f(x) + g(x), f(x) – g(x), f(g(x), f(x) *g(x), f(x)/g(x)…f(snoozefest)…you get the point.  It’s boring, they’ve done it before, and there’s not much high-level thinking involved.

Fortunately, it’s fixable by asking new questions from the same problems.  For example, have students choose a pair of functions from the book.  We have 99 choices after all!  For example, something quadratic and something linear,  like f(x) = x^2 + 1 and g(x) = 2x+4.

Here come the questions:

  • Which of these function operations are commutative and which are not?  How do you know this?
  • Does this work for all functions, or just the ones that you chose?
  • For what values of x are the non-commutative function operations equal?
  • What do you notice about those values of x for the different operations?
  • Can you prove any of your results?
  • How do the graphs of these new functions compare to the original graphs?

Compositions of functions are the most fun!  Here come some more:

  • For which values of x is f(g(x)) > g(f(x)) for your specific functions?
  •  Do your results hold true if both functions are quadratic?
  • Both linear?
  • How are the graphs of f(g(x)) and g(f(x)) related to both f(x) and g(x)?
  • Don’t forget about f(f(x)) or g(g(x))! How do those relate to our original functions?
  • What about g(g(g(x))) and g(g(g(g(x))))?
  • What do you notice happening each time we compose the function with itself again?
  • Can you generalize your conclusions based on the number of compositions and tell me what g(g(g…g(x)…)) would look like?
  • What do you notice about each of these compositions?
  • What do you notice about their graphs?

A personal favorite of mine is:  If 4x^2 + 16x + 17  =  f(g(x)), what could f(x) and g(x) have been?  This works really well with whiteboards and partners.

I might have students throw out any questions that they find interesting.  In fact, I’ll bet we can come up with at least 99 questions more intriguing than the ones given in the textbook.  Then let them choose which one(s) pique their curiosity.   Now hopefully we’ve taken the time that they would have spend doing 1-99 from a book and turned it into time better spent.