High school students are inherently unpredictable. I’ve been told it’s the condition of their pre-frontal cortex and they can’t help it. I’m sometimes baffled and confused by what intrigues and engages them. If you’ve seen their obsessions with Snapchat, you know what I mean.
Something that always gets teenagers riled up, however, is a statement that challenges their peer group. In fact, I found today, that they’ll engage at a much higher level when presented with data that questions their level of engagement.
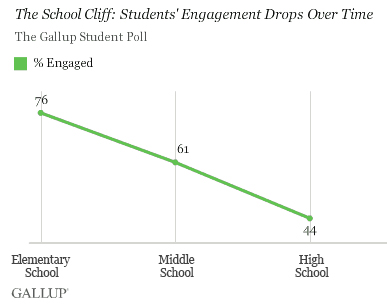
After a little guessing and estimating, I revealed this graph resulting from a recent Gallup poll on student engagement during my 9th grade statistics class today:

The kids were fired up right away. Even if students agreed with the representation, it seemed as though every kid wanted to share his or her interpretation of how student engagement changes over time. They shared their experiences from their formative years of education and respectfully expressed their frustrations for how much more difficult school gets each year. Surprisingly, the students seemed to place blame for the overall decline in curriculum immersion on themselves.
Until one boy opened up the floodgates with the proclamation, “In elementary school we get to learn by messing around with stuff. In high school, all we ever do is listen to the teacher talk and do boring worksheets.” Expecting me to dismiss this kid’s comment for daring to suggest that the burden of student engagement also lies on the teacher, the class was relieved when I asked this student to expand on his thoughts. Almost simultaneously, multiple hands shot up in the air agreeing with this sad truth many of them were thinking and this young man had the courage to say out loud. A rich, important, respectful discussion ensued about the difference between being busy in class copying, listening, and doing and being engrossed in activities that facilitate learning.
We continued the conversation by critiquing the methodology used to collect the data for this poll and the misleading representation in the graph. Sorry, Gallup, my 9th graders spotted the flaw in the using in a self-selected study to represent all students right away. They also debated the validity of broad categories such as “Elementary School” represented only by 5th graders rather than K – 5.
We discovered that the actual Gallup Student Poll is available online. The students agreed that Friday was probably not a good day to do a survey about school engagement, but we’re really looking forward to collect and analyze the data on their classmates.