Visual Patterns – Visible Improvement #MTBoS – 3

For a few blog posts now, I have been singing the praises of Visual Patterns and how they have helped my classes to make concrete connections between an abstract formula and a visible pattern.

Friday was our test on Quadratics.  I put pattern #86 on the test the students had 2 tasks:

1.  Find the number of circles in step #6.  [I wanted a question that most students would do correctly, to keep the barrier to entry low.  Step #5 resulted in the number that math teachers hate the most, so I went with step 6 instead.]

2.  Write a simplified formula for the nth step.

I took multiple pictures of student work to compare their different methods of arriving at the simplified answer of n^2 +8n + 4.  My favorite though (and the one that most represents the growth I’ve been hoping for) is the student that abandoned the algebraic method of creating a system of equations from the table for a more conceptual representation derived from generalizing based on the picture of the pattern.

Here is that student’s work:

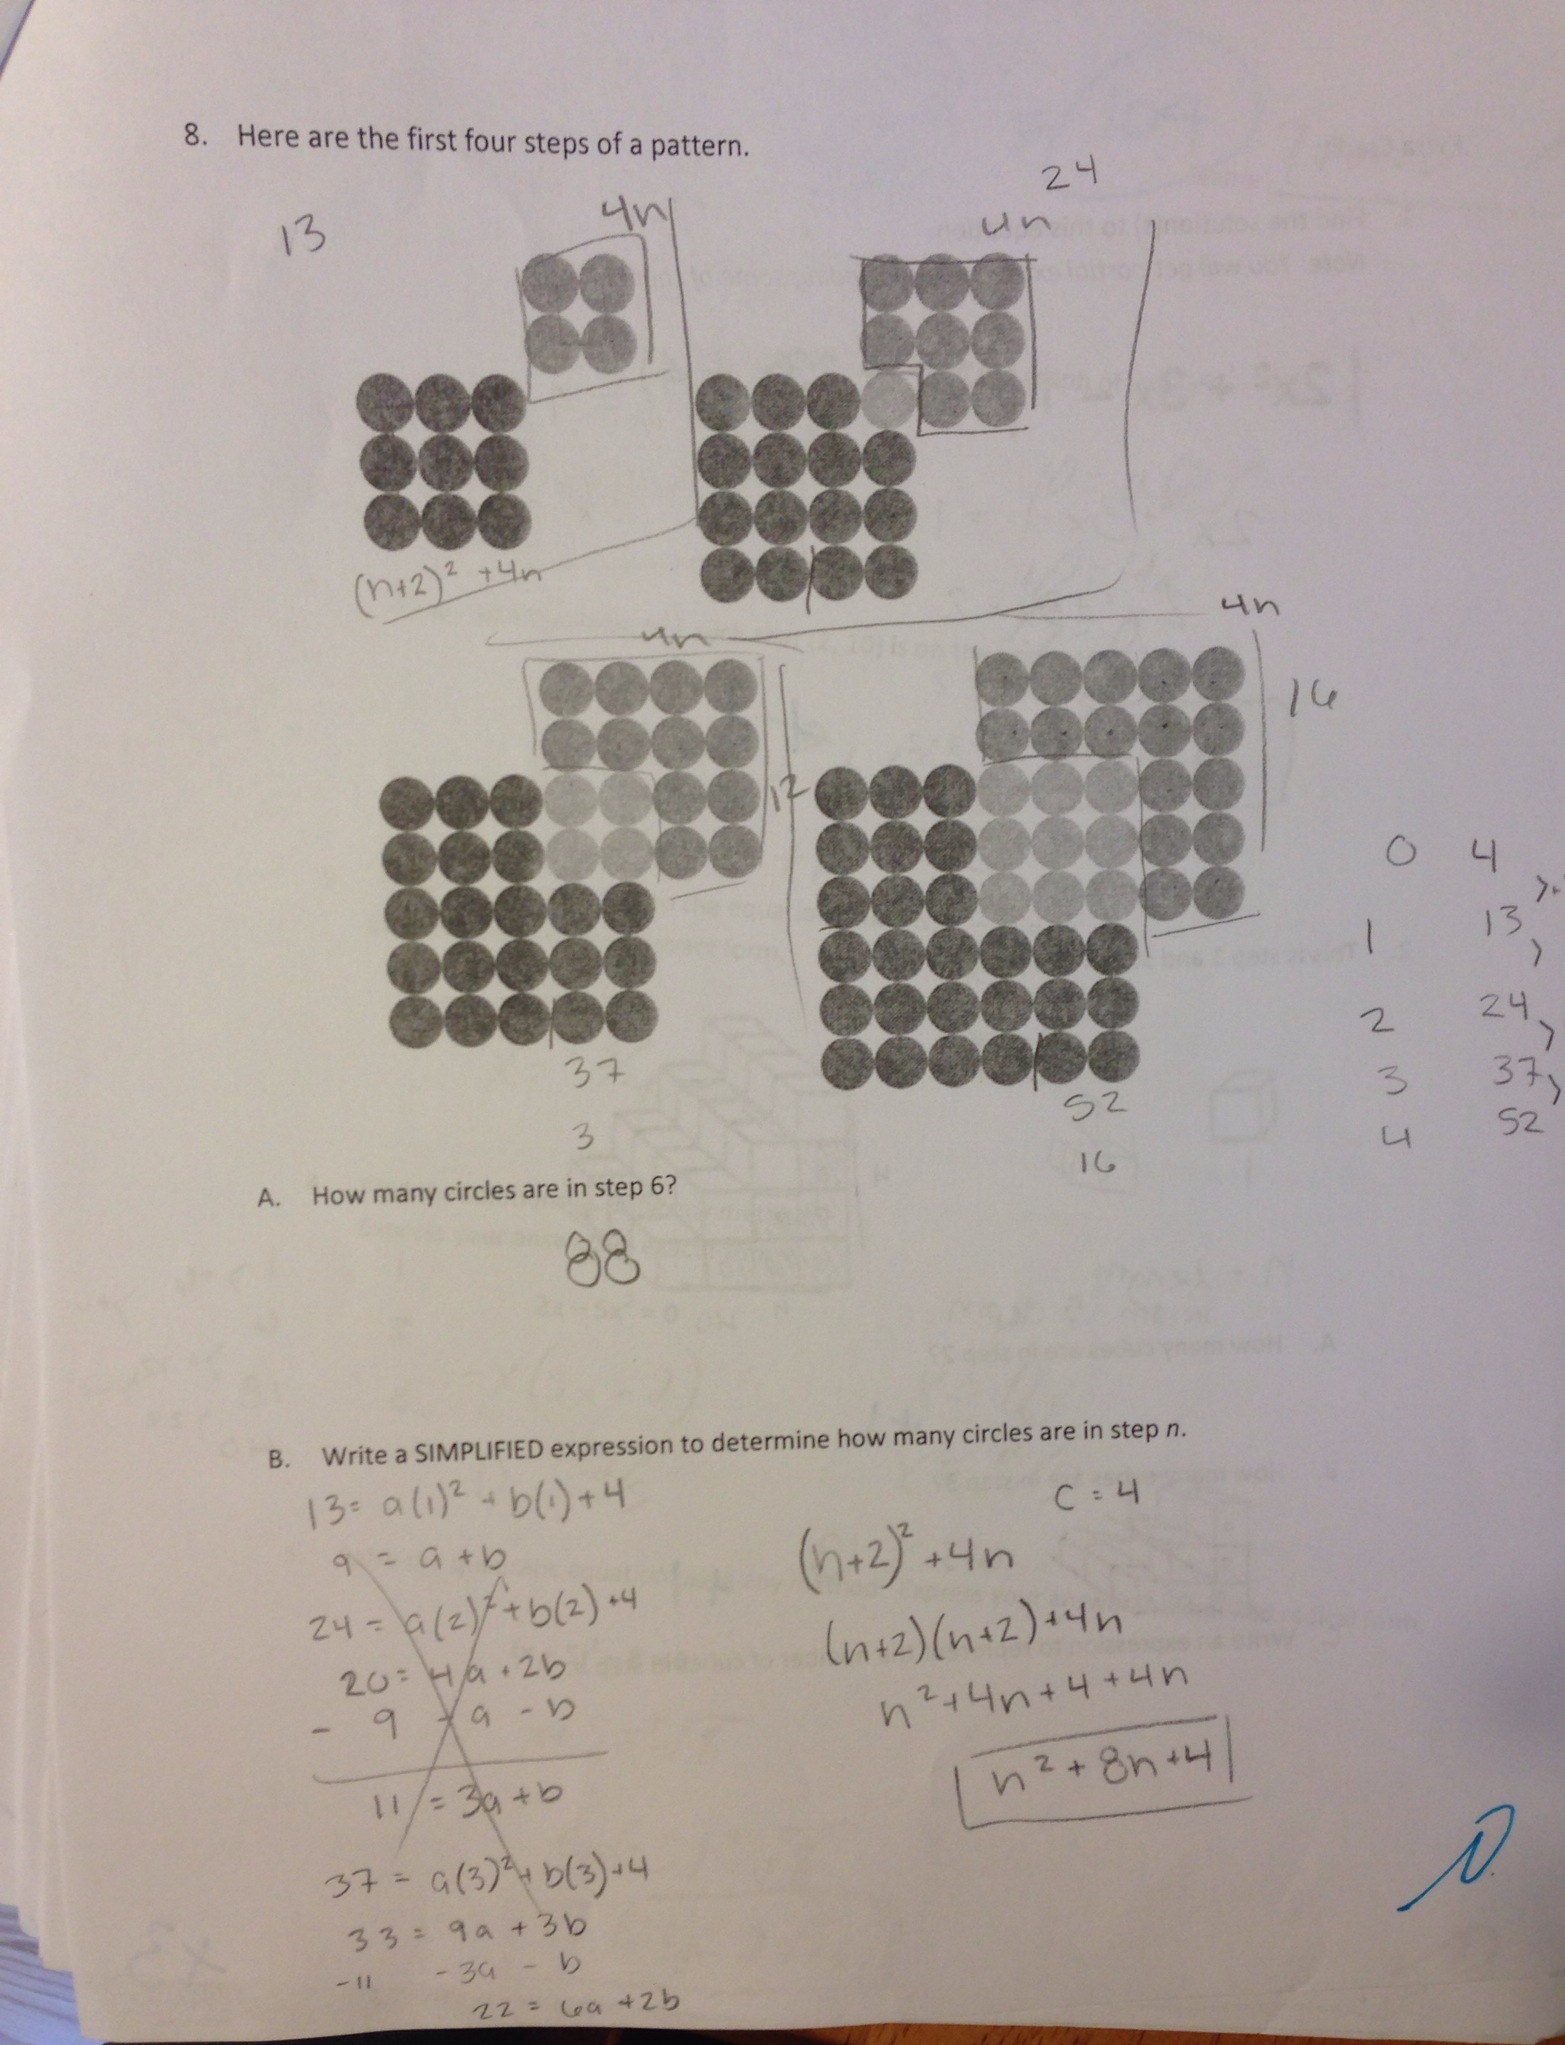
I love how the student got most of the way through the algebra and still opted for the other approach.  The student even figured out the “c” value of the quadratic, which is the value that students opting for the algebraic approach struggle with the most.  These students are realizing, after 8 weeks of struggle, that they cannot easily recall since they were usually memorized rather than grounded in conceptual understanding.

Here is another student’s work:

image

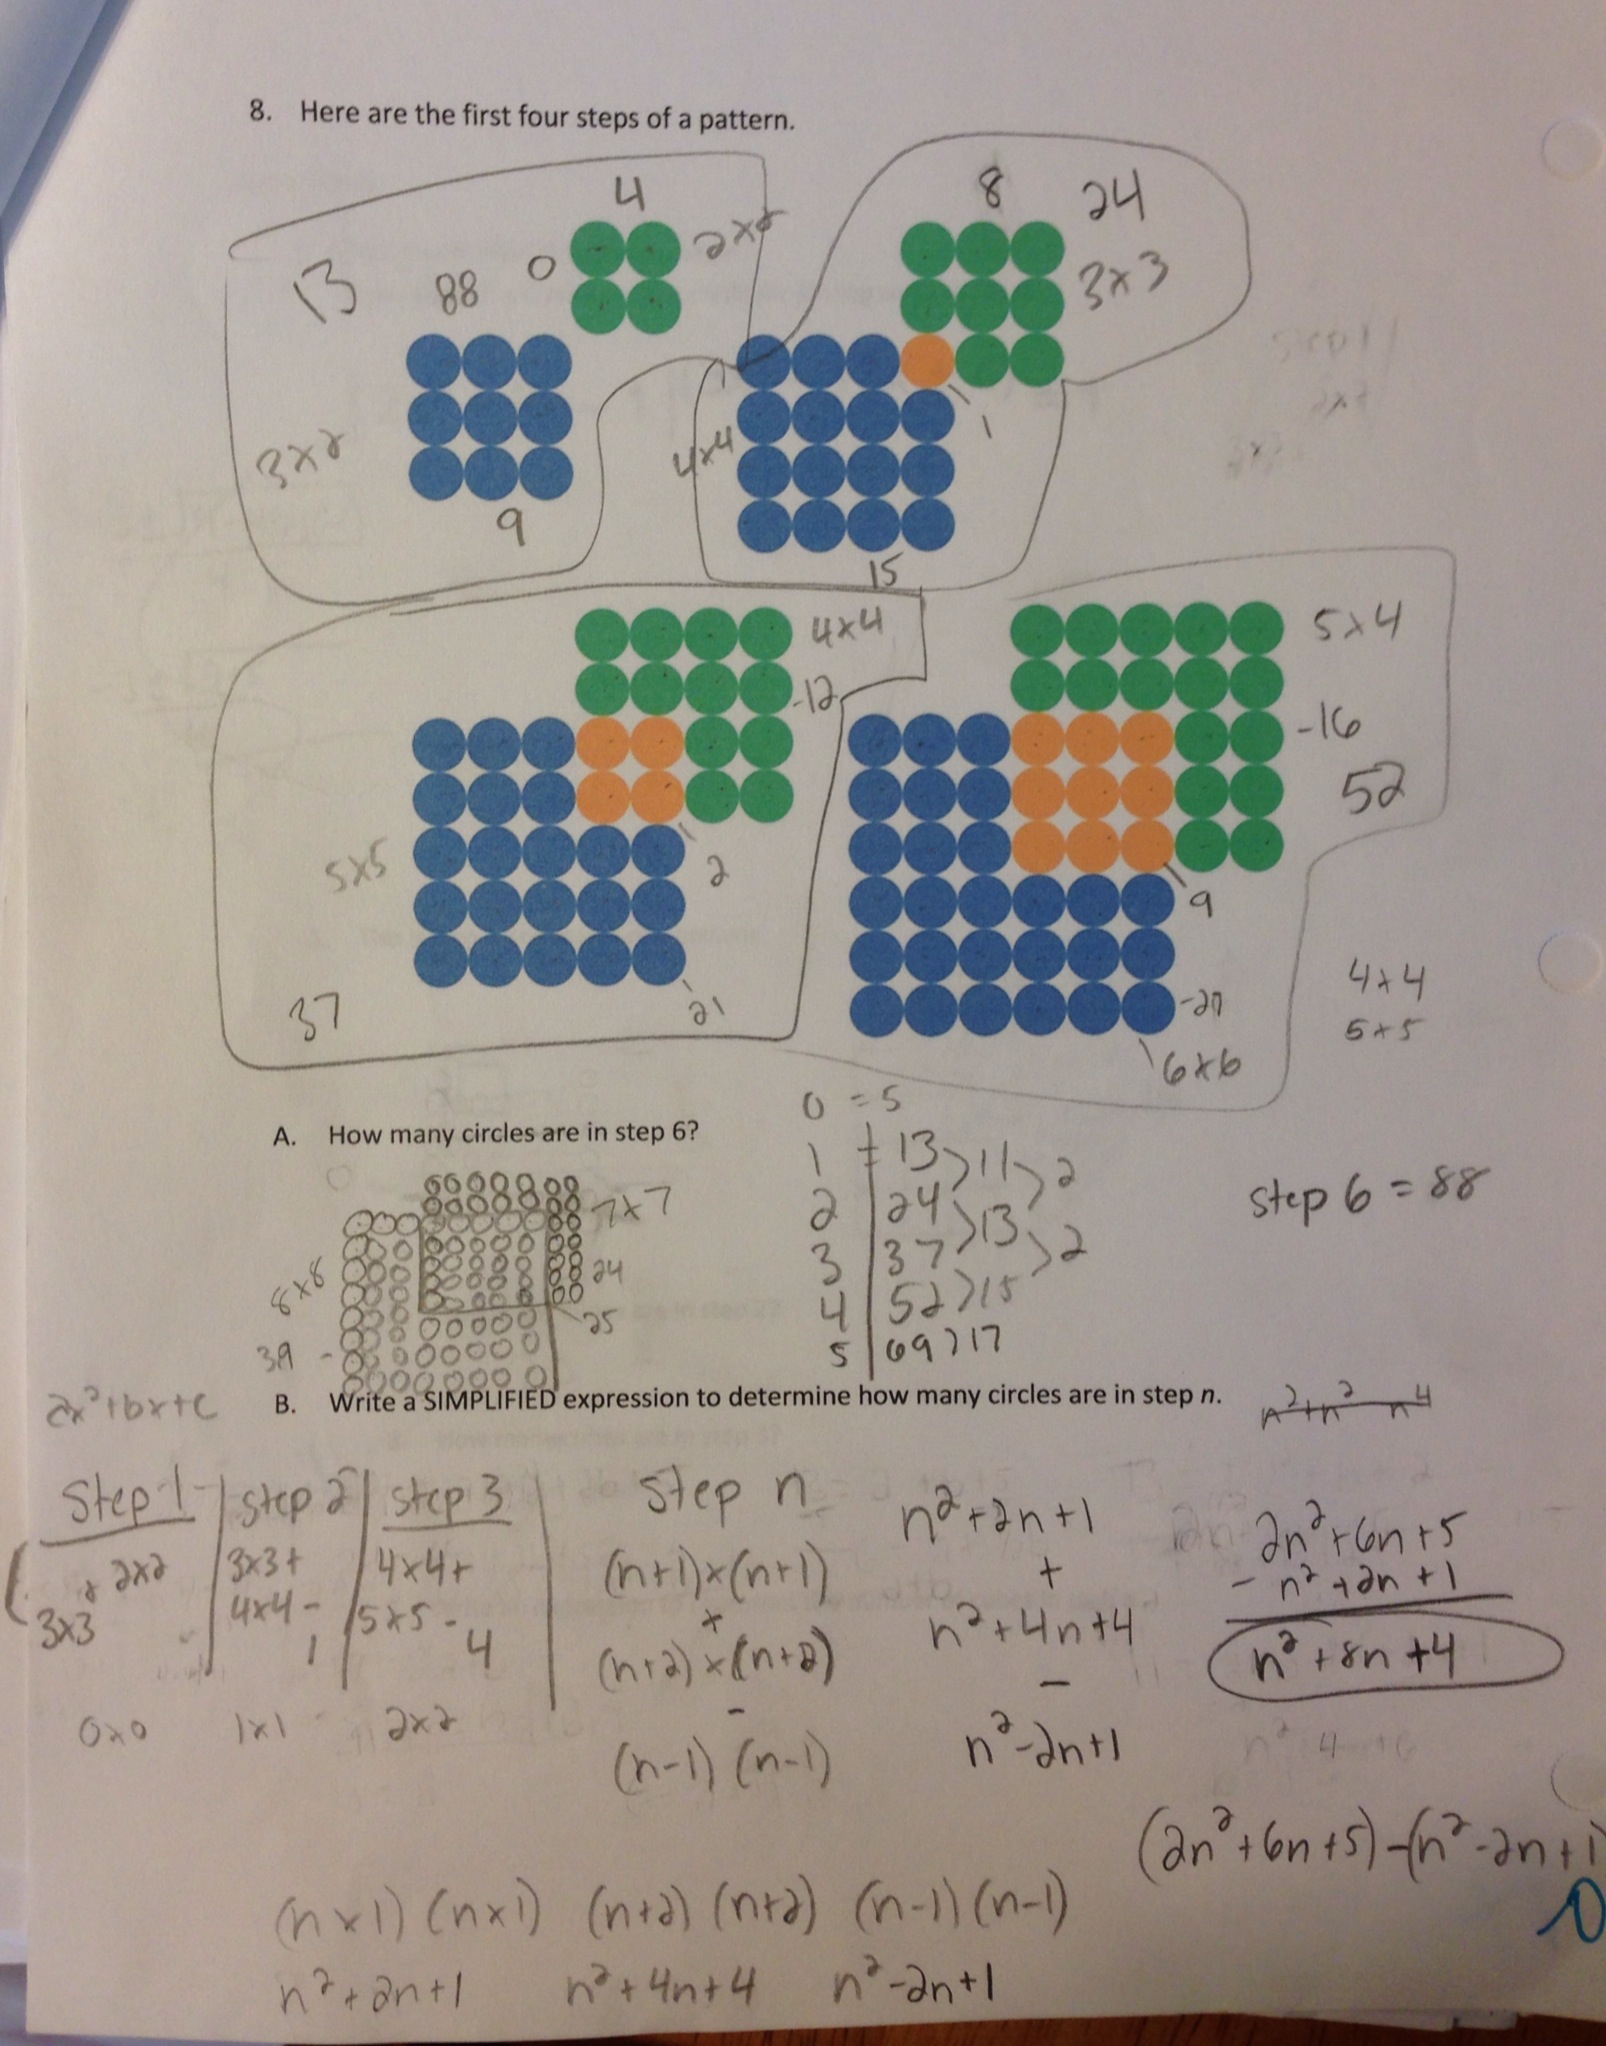
This student came in before school to take the test because she was going to miss the class period due to a field trip.  (which is why her test was printed in color).  Anyway, it took her a while to finish this problem.  I was so proud that she was able to arrive at the correct answer with lots of persistence and without relying on an algebraic algorithm.  At the beginning of the trimester, this is one of the students that would stop when she reached difficulty in a problem and then would wait for someone else to put up the correct answer so she could memorize the method.  I’ve seen her move from that lack of confidence to a place where she is willing to make mistakes so she can formulate her own methods for solving problems.  I’m very impressed with this girls (and this class’s) efforts.

Oh, UNIfix cubes! I get it!

I’ve done a lot of professing my new found love for Visual Patterns lately, and today will be no exception.  If I haven’t convinced you of the flexibility and differentiation available in these seemingly simple patterns, let me have one more stab at it.

Today, my College Algebra class looked at pattern # 28.

I took out the unifix cubes for those who wanted to actually have the three dimensional shape in front of them.  This was helpful for some, however, I realized the limitations of the cubes…the fact that they only will “fix” to one other cube (hence the name UNIfix). This may not be mind blowing information to many of you, but I just put those two things together in my brain today.  Because of the one fixture, they were hard to take apart in usable “chunks” without the whole figure falling apart.

Anyway, back to the pattern. I wanted to workout ahead of time all of the possibilities that students would come up with so that I could more effectively use the 5 Practices of Orchestrating a Mathematical Discussion and anticipate their responses.  I’ll tell you what, I played around with those expressions so many times, and thought for sure I had came up with at least the majority of responses I would encounter. They were all quadratic. Then, out of left field, the students threw me for a loop. The majority of students came up with n^3 – (n-1)^3!

Now, you might be thinking, duh! It’s 3 dimensional AND a portion of a cube.  However, my algebraically trained brain started with quadratic expressions and stuck with them since I saw from the difference of differences table that this pattern was in fact, quadratic.  Yes, the n^3 terms get cancelled out when the expression is simplified and the simplified expression becomes quadratic but this opened up a whole new avenue of discussion with my class. We were now able to talk about the misconceptions of expanding something like (n – 1)^3, because if they found the expression for the nth step another way, they could use that as a check for simplifying their answer.

What was eye opening for some of the students that chose an algebraic method (such as using a table of differences and then setting up a system of equations) was that the “c” value in ax^2 + bx + c was hard to conceptualize.  It was very difficult for students to grasp that the first term and the non-existent “zero term” had the same number of cubes.

Finding the surface area formula for step n was even more awesome, because it was in this portion of the pattern that I was able to see real growth in my students’ willingness to attempt a more conceptual method.  There are certain students whose default method is to set up a system of equations using the table of values for the pattern steps. These students are noticing more that they encounter errors much more often than those who have a conceptual understanding of how the pattern is built.  I found this time around, less students relied on the algebraic method (about 7/35) whereas last week, probably 15/35 of them were starting algebraically.  As we are covering more and more concepts in this course, the students are realizing that they do not remember specifics about formulas and procedures from their previous algebra courses.  They remember “learning” the topics, but they usually can’t quite nail down the specifics of each method.  I really feel that we are making some good headway toward solidifying their conceptual understanding of the algebra as I see more and more students break away from the procedural methods toward a more conceptual one.

We talked about this pattern for an entire 60 minute class period.  You know it’s a good day when kids look at the clock and say, “whoa! Class is over already?”

Olympians, Tweagles, & Friends in my Phone

I started tweeting in 2008, around the Beijing Olympics. It was cool that actual Olympians would respond to my tweets.  When Summer Sanders responded to one of my tweets, I about fainted. Twitter was new, they probably didn’t know any better.  

I followed a few celebrities. I found some of their off-color honesty hilarious and sad at the same time.  In the meantime, my hilarious brother managed to rack up tens of thousands of twitter followers. (@sucittam if you are looking to add some hilariousness to your timeline). Here’s one of his tweets being featured on Ellen:

He opened my eyes to the idea that following actual REAL people is more entertaining and fulfilling. He was absolutely right.

I went through a phase where I followed a bunch of people who tweet as their beagle.  I’m pretty sure I was the first one to use the term Tweagles, although I have no proof of that. 

Then in January 2013, my indifferent view of people on twitter changed forever. My 29-yr old sister in-law, Danielle, suffered a massive brain aneurysm and it wasn’t certain she would recover.  She was in the ICU at the University of Iowa for almost 6 weeks, and while my brother stayed by her side every day, his twitter followers rallied support that went viral. All of these people, most of which he’d never met, wanted to reach out to help. Benefits were organized, gifts were donated, and memorabilia was auctioned all to benefit Danielle whose recover was slow, but steady. 

Rex Huppke (@RexHuppke) wrote a beautiful article illustrating that the people we interact with on twitter are not just cyber-acquaintances.  Danny Zucker makes the best point:

 “We’re willing to accept the concept that cyberbullying is real, and it is. But if you can accept the idea that the negative is real, then you have to accept the idea that the positive is real. If strangers can hurt you, they can be friends as well.”

And just like that I leaped head first into the T of the MBToS. I realized that people like Fawn Nguyen, Andrew Stadel, Kate Nowak, and Christopher Danielson were real teachers just like I was.  They had great blogs, and they were on twitter too. And if I wanted to get a real benefit from all of the resources I had found online, I needed to start posting feedback of how I incorporated them into my classroom.  And then tell the creator of the activity about how it went. Through this I’ve really been able to experience the genuine human behind all of these @ symbols. These are not only great teachers who don’t just shine on their own. They want to freely share what they’ve done so that others can shine just as brightly. 

A Visual Patterns Trifecta

This is my third (and most exciting) post about my new found love for Visual Patterns.  My enthusiasm stems from a growing appreciation of how these patterns can be used in such a wide range of grade-levels, including advanced algebra.  The use in an elementary or lower-level secondary classroom is easy to see.  However, the teacher and student need to dig a bit deeper into the make-up of these patterns in order to generalize them.

For example, here is Pattern #8.  Kudos to Fawn Nguyen on this one.

It’s not immediately apparent what step 4 should be.  But even more so, the quadratic nature of this pattern is not necessarily simple to comprehend.  From yesterday’s pattern #5, the students had a method for finding the number of penguins in the nth step by converting the penguins into a table and creating a system of equations.  I didn’t want to encourage this method, as it is very procedural and tedious.  However, it was a good place for students who liked to work in a more algebraic way to feel successful.

Also, the table allowed them to explore what the difference of differences really told them.  I had a student, let’s call her Kay, ask “I wonder what the constant difference of differences represents in our equation for the nth step.”  She came up with a conjecture by comparing it to our problem from pattern #5.  Kay concluded that the “a” value in the equation ax^2 + bx + c = y is half of the constant difference of differences.  I challenged Kay to continue to examine these values in future problems to see if her conjecture holds true.  I had another student, Em, wonder if that meant that the “a” value in a cubic function is equal to one third of the difference of difference of differences.  This she will investigate as well.  What is very exciting about these questions is that they were non-existent 5 weeks ago.  It wasn’t that the students didn’t WANT to be mathematically curious, they just didn’t know HOW.  It was a huge thrill for me as a teacher to see these kids move from looking at a math problem with a single solution to being able to ask new questions.  A nod to Christopher Danielson for helping me realize that learning is having new questions to ask.

  Back to the problem at hand:  How many penguins are in step n?  A few of the students were able to get the answer without using a table.  These were mostly the students who like to do things in their head.  The ones who want to fully process the problem in their brain, but not write any of it down.  [Side note:  these are usually the ones who are brilliant with numbers but get lower grades in traditional math classes because they don’t want to “show their work.”] Anyway, I wanted to challenge those who used the table method and set up a system of equations to relate their model back to the picture.  Spoiler alert!  The answer is 1/2n^2 + 1/2n + 1, but I wanted my students to be able to relate that back to the picture.  What do the individual pieces of the expression represent in penguins? This way, the students were able to make that connection of a picture or pattern that didn’t seem quadratic to begin with and flesh out its quadratic properties.

When the students figured this out, it was a magical moment.  I had to capture it:

IMG_2993

Another cool experience with this problem:  the same evening that I did this problem, our school hosted parent-teacher conferences.  One of my students came into conferences with her parents and her three little sisters, ranging in age from about 5 to 10.  One of the little sisters sat down and wanted to be part of the conference.  I pulled up the visual pattern and asked her how many penguins would be in the next step.  It was a validation of my initial thoughts of how open and accessible these problems are to all levels of mathematics.  Here was an 8? year-old looking at the same pattern that her 17 year-old sister explored earlier that day.  And it was mathematically applicable to them both.  Beautiful.

I’m gushing again over Visual Patterns

Today we looked at Pattern #5 from visualpatterns.org.

I was intrigued by this one because I thought they looked like crab claws.  Anyway, what was fascinating about this one was that the kids did not immediately expect it to be quadratic.

They came up with the following pre-simplified expressions for the nth step:

  • 2n(n+1) + 3
  • 1 + (n^2 +n^2) + (n+1) + (n+1)
  • 2[n(n+1)] + 3
  • 2n(n+1) + 3
  • 3 + [(n+1)n] + [(n+1)n]
  • 3+2(n+1) + 2[(n+1)(n-1)]   **This one was the most intriguing to me.
  • 2n^2 + 2n + 3

For each of these, I had the student put the expression on the board.  I then had different students explain the thinking of the student who came up with the expression and relate it to the pictured pattern.  I saw a real improvement here from when I had them do this activity the first time last week.  I had many more students volunteer to explain the thinking of their cohorts and much less hesitation to work out what the terms in the expressions represented.  The students sort of thought of ‘explaining thinking’ that was only represented by numbers and n’s was like decoding a puzzle.  They could see that they all simplified into the same final expression, but working backward to find where that expression started was part of the challenge that they have been more willing to accept.

Here’s a picture of some of their work.  I’m sure they’d be thrilled to be part of my blog post.

photo (1)

What was REALLY special about this pattern is that we were able to relate it then to quadratic equations in x,y coordinates.  We talked about all kinds of things related to quadratics such as what the +3 means in the pattern and in the quadratic graph, how we could use the “0” step to make finding the quadratic equation easier, and how a system of equations could be set up as well to find the coefficients of the x^2 and x term.

What I really appreciate about this website is that there are so many extensions to all of the patterns.  There is no much more for students to uncover other than finding the 43rd term.  I love that I am able to use these patterns in multiple levels of my math classes and the students are given the opportunity to pull out the necessary mathematics.

Visual patterns with a side of awesome sauce

Regular old Wednesday turned amazing today when I posed pattern #2 to my math recovery class, a remedial math class for kids to recover credit from a previously failed course. It may not need mentioning, but just to be clear, these kids hate math and think they’re no good at it. In pattern #2, the kids need to find how many cubes are in step 43 and the surface area of step 43. Side note:  My kids wondered, why 43, Mrs.Nguyen?


Anyway, finding the surface area was where the magic started to happen. I had 4 or 5 kids out of this class of about 15 get seriously invested in finding out the answer. They were drawing pictures, explaining their thinking to one another, figuring out different ways to think about the problem. It was inspiring and motivating for both them and me.

As if that wasn’t enough to make it a great day, I decided to pose the problem to my College Algebra class as a starter and try my hand at the 5 Practices for Orchestrating Productive Mathematics Discussions. My expectation was that they found the number of cubes and surface area of step ‘n.’ What was gorgeous about this problem was not necessarily the answer, but the numerous ways they came up with to arrive at the nth step. Here are a few:

n + n + (n-1) + (n-1) + n + (n-1) + n + (n-1) + 2

4(n-1) + 4n +2

4(2n – 1) + 2

6 + 8(n-1)

4[n+(n-3)] +10

6(n-1) + 2n + 4

8n – 2

What was even more powerful was, as Ben Blum-Smith calls, an effing game changer.  He’s right, and this was beautiful.  I used the tactic he lays out in his blogpost where students are asked to summarize the ideas of someone else.  I had a few try to slyly summarize their own ideas, but alas, I would have none of it.  As a result, I had more engagement, more involvement, and more buy-in that this problem solving process is helping them to understand the mathematics more deeply.

Here is an exchange between two students (T and C) that is worth highlighting.  T is the student who came up with 6 + 8(n-1) as the surface area for step n:

C: Oh, I see.  T just used the arithmetic sequence formula.  The first term is 6 and it goes up by 8.

T:  Actually, that’s not what I was thinking.  I thought that there were 8 sides of the figure that had ‘n-1’ squares and then 6 squares left over, two on the caps and 4 in the corner.  OH, you’re right, it is the formula.

Then the lights came on.  This girl who had probably only known mathematics and algebra to be a long list of rules, procedures, formulas, and practice was able to experience that developing a conceptual understanding of this pattern help her to create the arithmetic sequence formula.  It was the bottom-up approach that I’d been talking about all trimester where developing conceptual foundations are where real math learning happens.

Nrich Love Affair: MTBoS challenge #1

I told my husband that if we weren’t already married, I’d run away with nrich in a heartbeat.
That being said, it’s probably no surprise that my favorite problem comes from nrich: consecutive sums and is my response to the explore the mtbos mission 1.
I’ve used this problem a few times, with high level students, low level, and in between as well.

Here’s a poster with a general overview of the problem.  The link from nrich provides starting help as well as teacher notes and a solution.

Some things I love about it:
1. So many points of entry and a low barrier.
2. So many paths. I’ve had so many different conjectures arise from this problem because of the open-ended nature of it and its ease of exploration. The numbers are not intimidating so students are unafraid to explore some of their findings.
3. Multiple extensions. For example, do consecutive differences work similarly? What about consecutive products? Or better yet, the difference of consecutive products!
4. Students organize their work in so many different ways. It’s completely fascinating to see it happen.

When doing this with a lower level class, I usually have them make a list of noticings and/or wonderings. This way, the patterns they learn to communicate what they believe to be true in their head. I may challenge them to generalize a little, especially with odd numbers always being a consecutive sum.

The most exciting thing that happens when I do this problem is the “what ifs” that students can’t help but think up themselves.  For example, What if we took the difference of consecutive numbers?  What if we took the sum of consecutive odd or even numbers?  Consecutive square numbers?  Triangle numbers?  Negative numbers?  It’s pretty amazing to be part of.

If you have tried or try this problem in the future, I’d love to collaborate on it.

Correlation Investigation

A benefit of having advanced students for probability and statistics is that there is often a level of curiosity in the room that can drive an entire class period of discussion. Sometimes.
We were about to start a unit on linear modeling and correlation, and I decided to start with giving them the data and the best-fit line and then having them determine the correlation coefficient based on some examples. We used a data table of 21 common cereals, all with calories, sugar, fat, and carbs per 1 cup portion.
The students first were given time to notice and wonder and I had them determine what two columns of data were most closely correlated and least related. We came up with a list for both and then we started number crunching.
The NCTM website has a nice set of core math tools . The Java-based app lets you put in data and then will have students “guess” the correlation coefficient from a list of 4 choices. Some kids made conjectures about how correlation coefficients were calculated. Others refuted these with counter examples. It was a beautiful discussion. In the process, we compiled the correlation coefficient for all of the data sets and this answering our other question about which sets were most and least related.
Finally, I set them off on the map shell lesson about devising a method for measuring correlation. This was just the intro to this lesson. The real fun started the next day…