Bingo Lingo

This time of year, the standards used to measure the success of a lesson may look different than they do at other times of the year.  For example, some teachers might consider “Students not using worksheets to have paper airplane throwing contest” to consistute a lesson well executed.  To a certain extent, I am joking, but there’s a thread of reality there.   Think back to a time when your excitement for a future event prevented you from doing anything productive.  Now imagine leading a room full of 32 people with that same excitement and handing them a manual for their new scanner/copier.  You get the idea.

I can usually distinguish between my being pleased with a lesson based on lowered expectations and my being pleased with a lesson because of a high level of learning and collaboration.  Today was the latter, with my 9th grade probability and statistics class again.

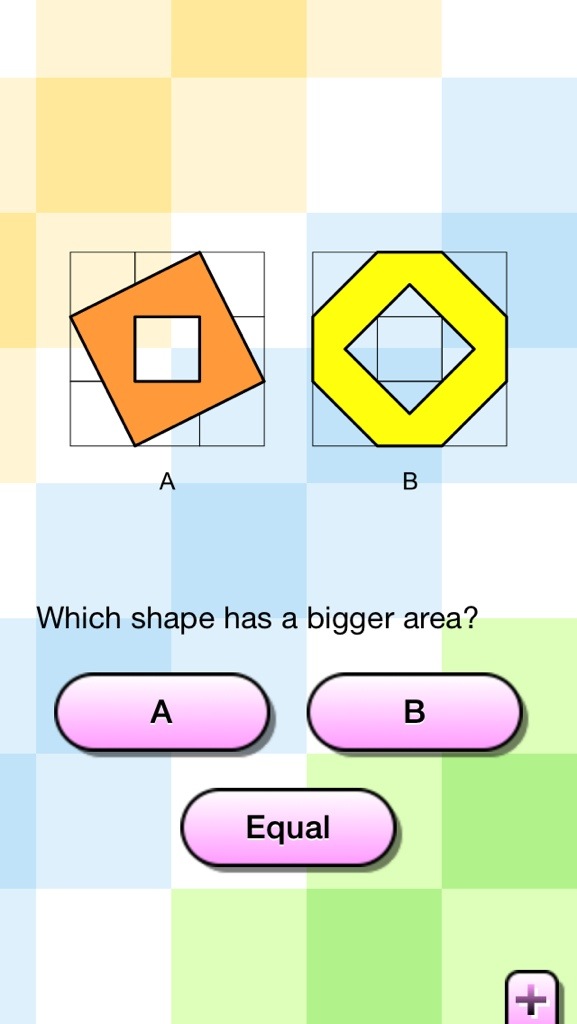
I found this on Don Steward’s website.  If you have seen his blog and are not fascinated, or at least intrigued, we cannot be friends.  He comes up with some amazingly simple, yet elegant classroom problems.

Picture1  Picture2 Picture3


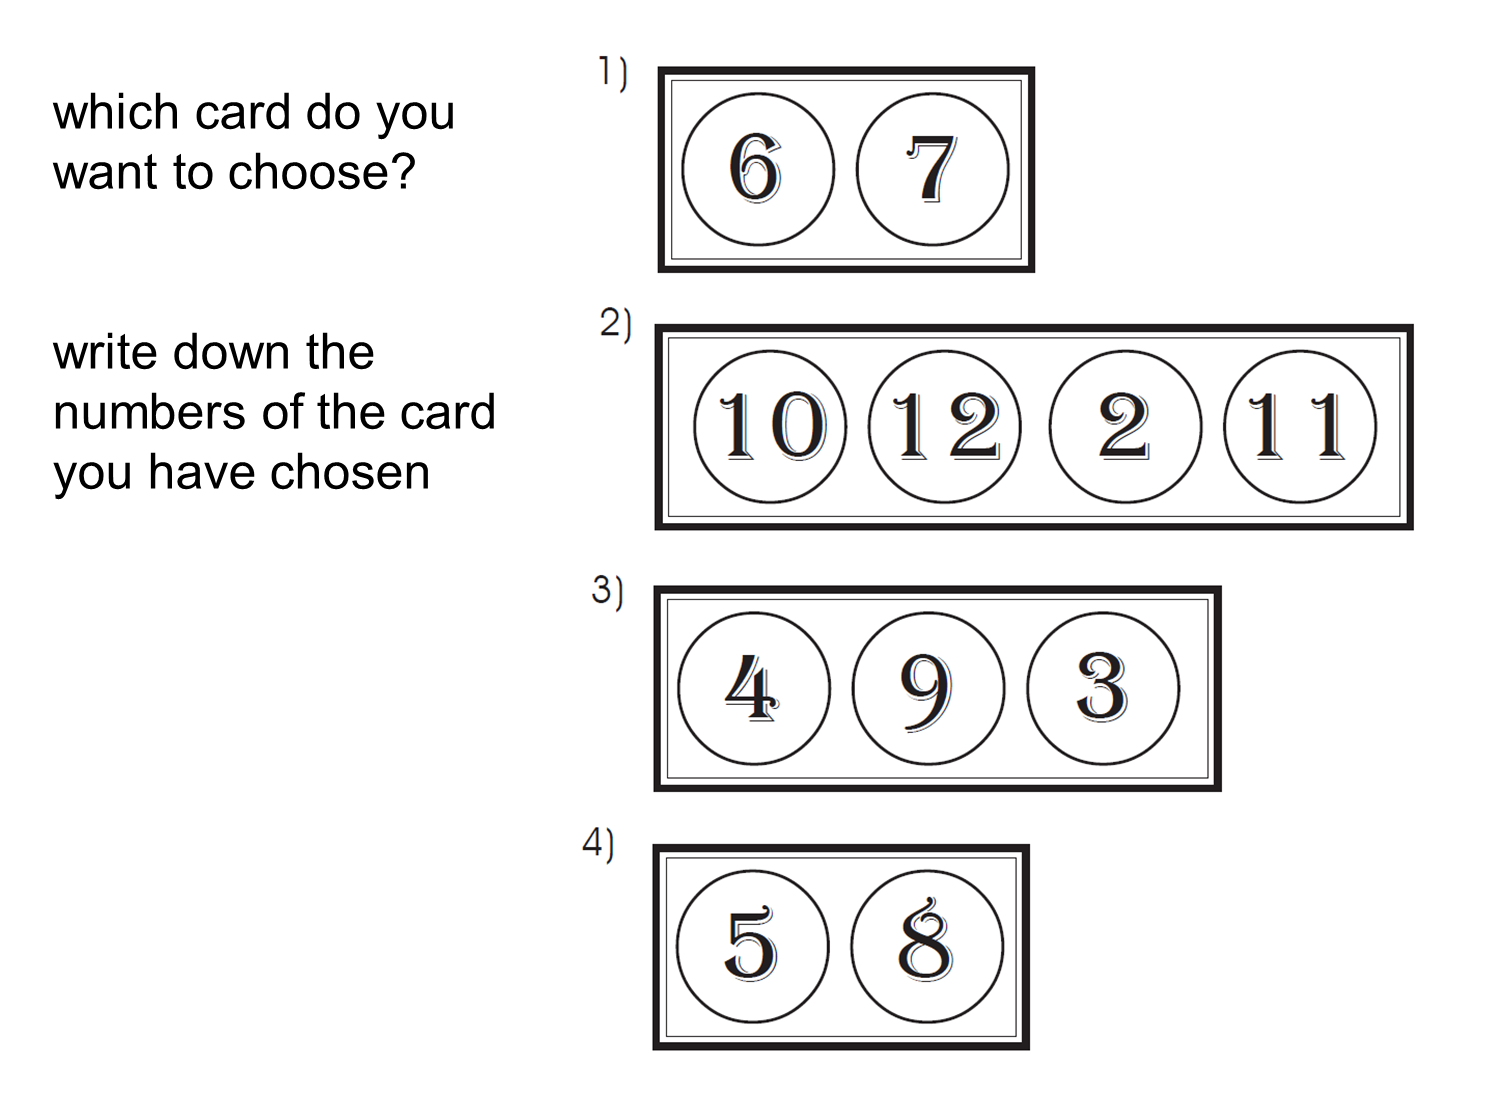
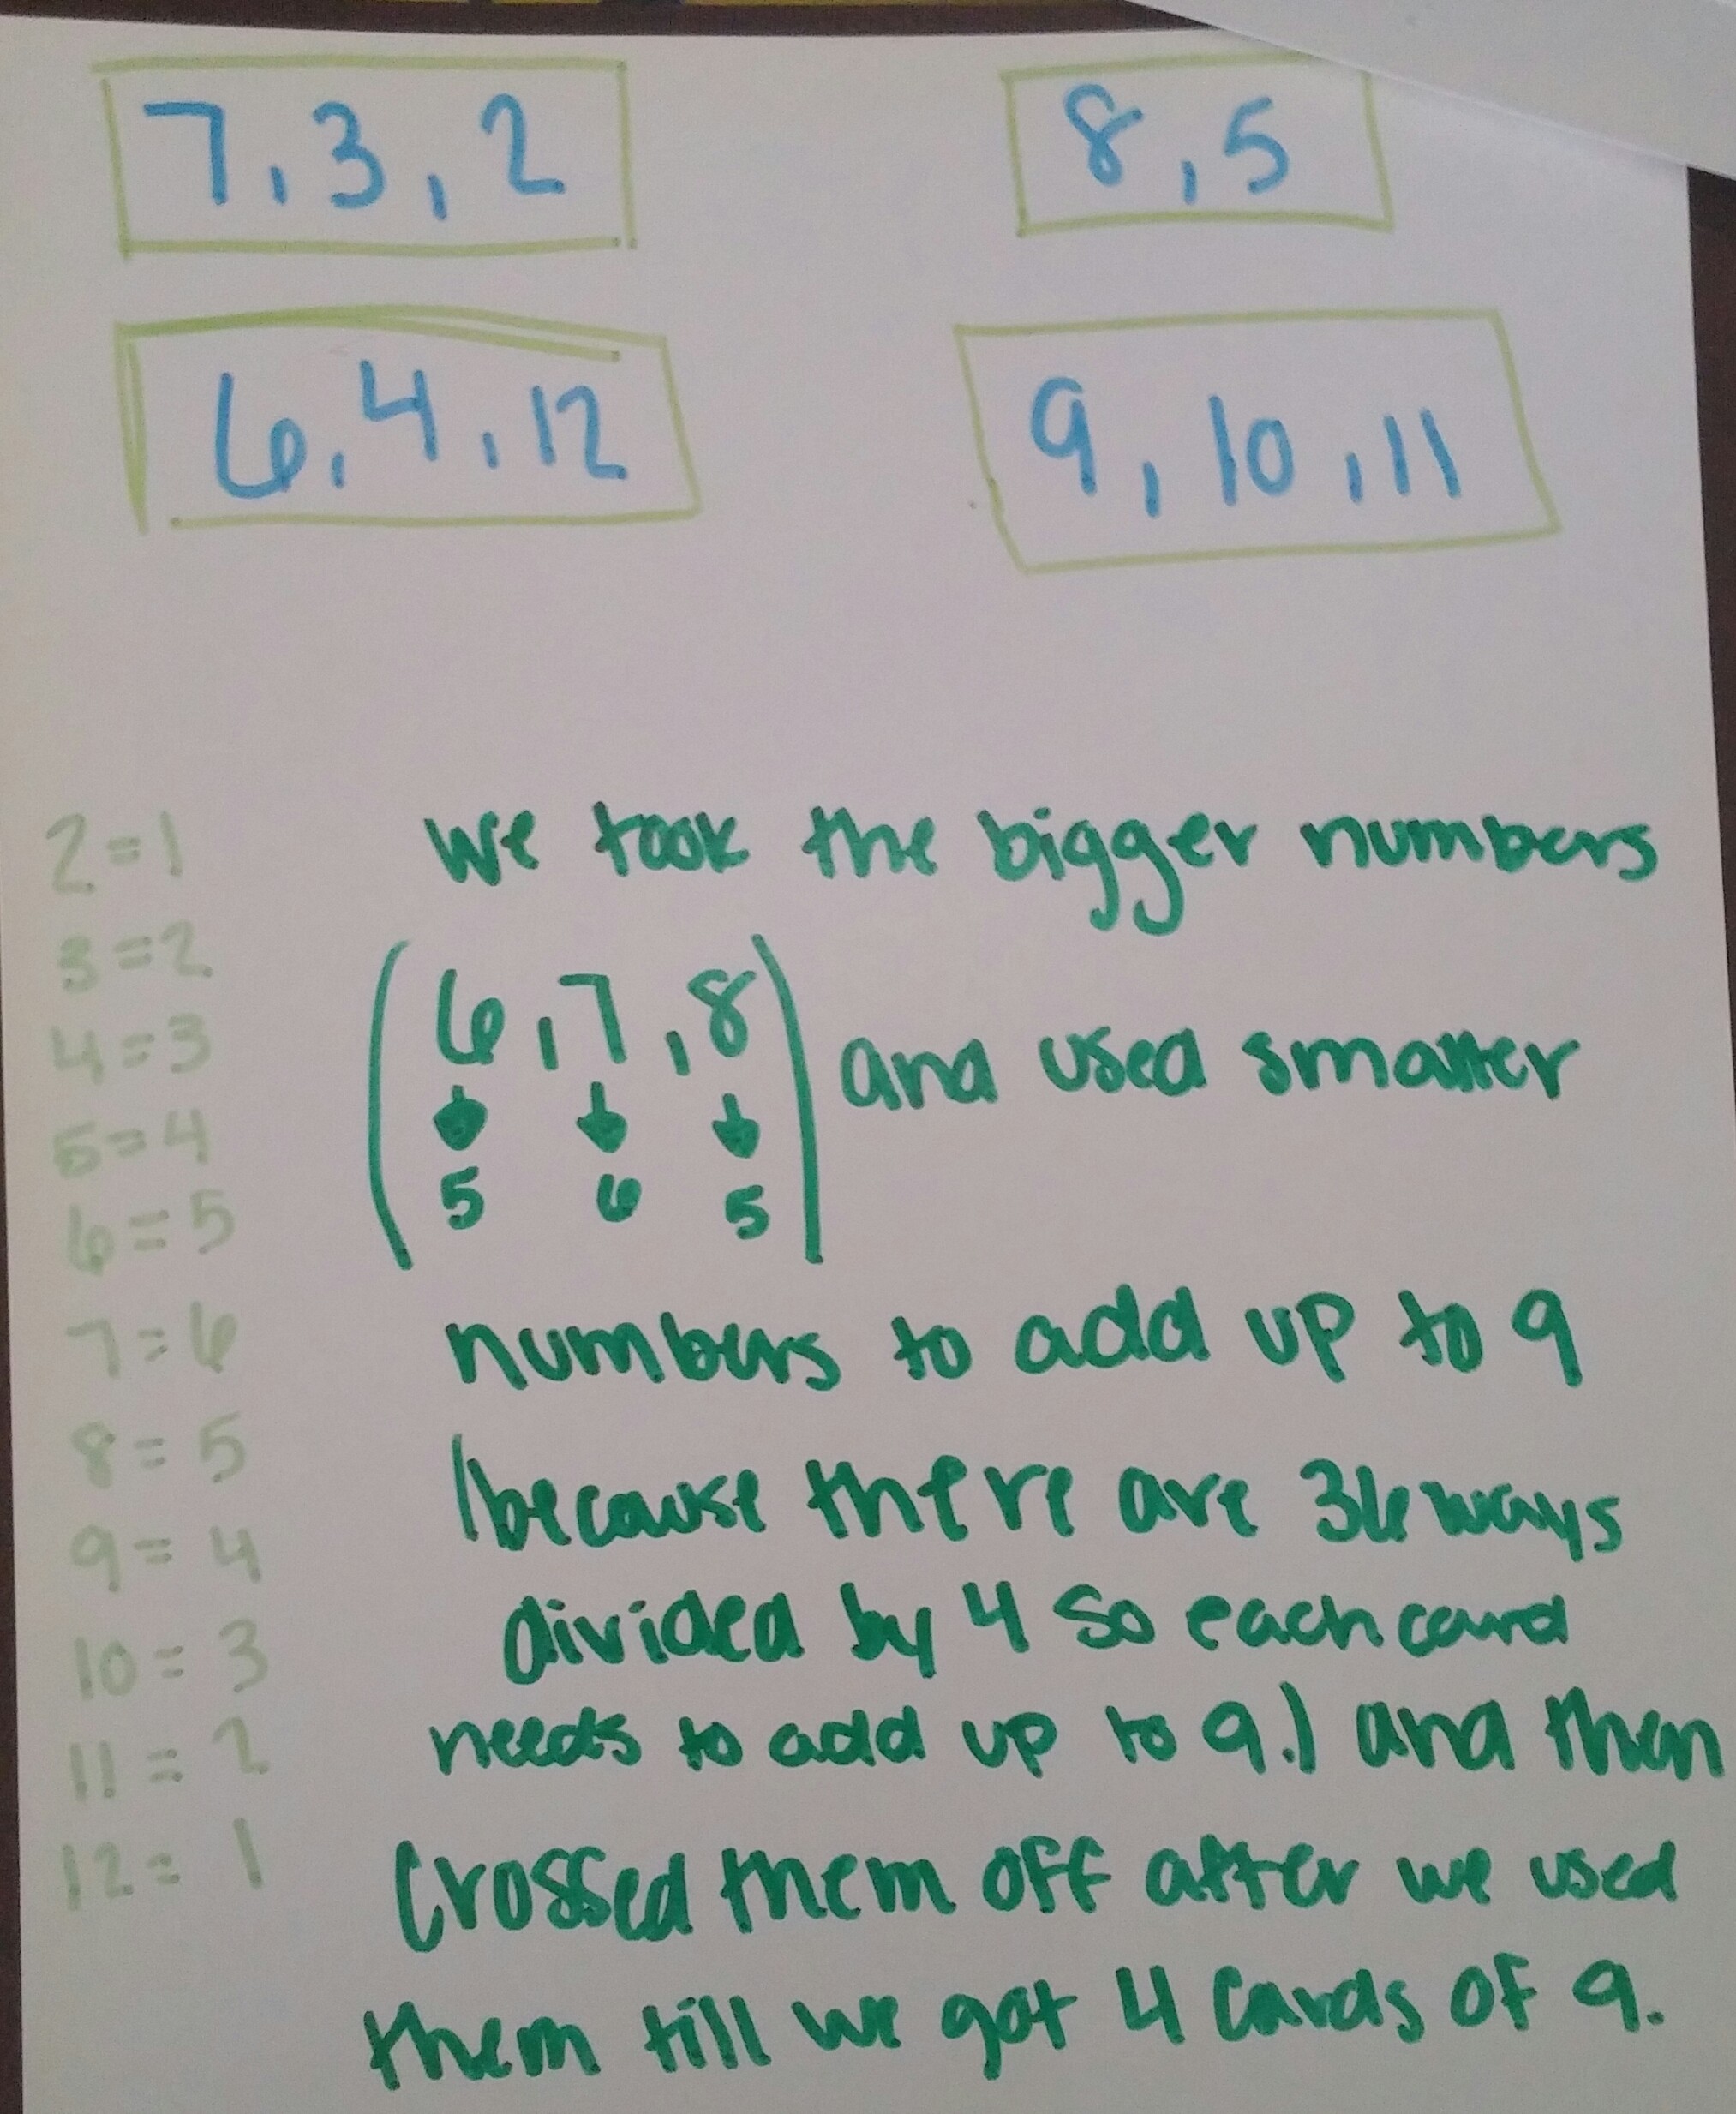
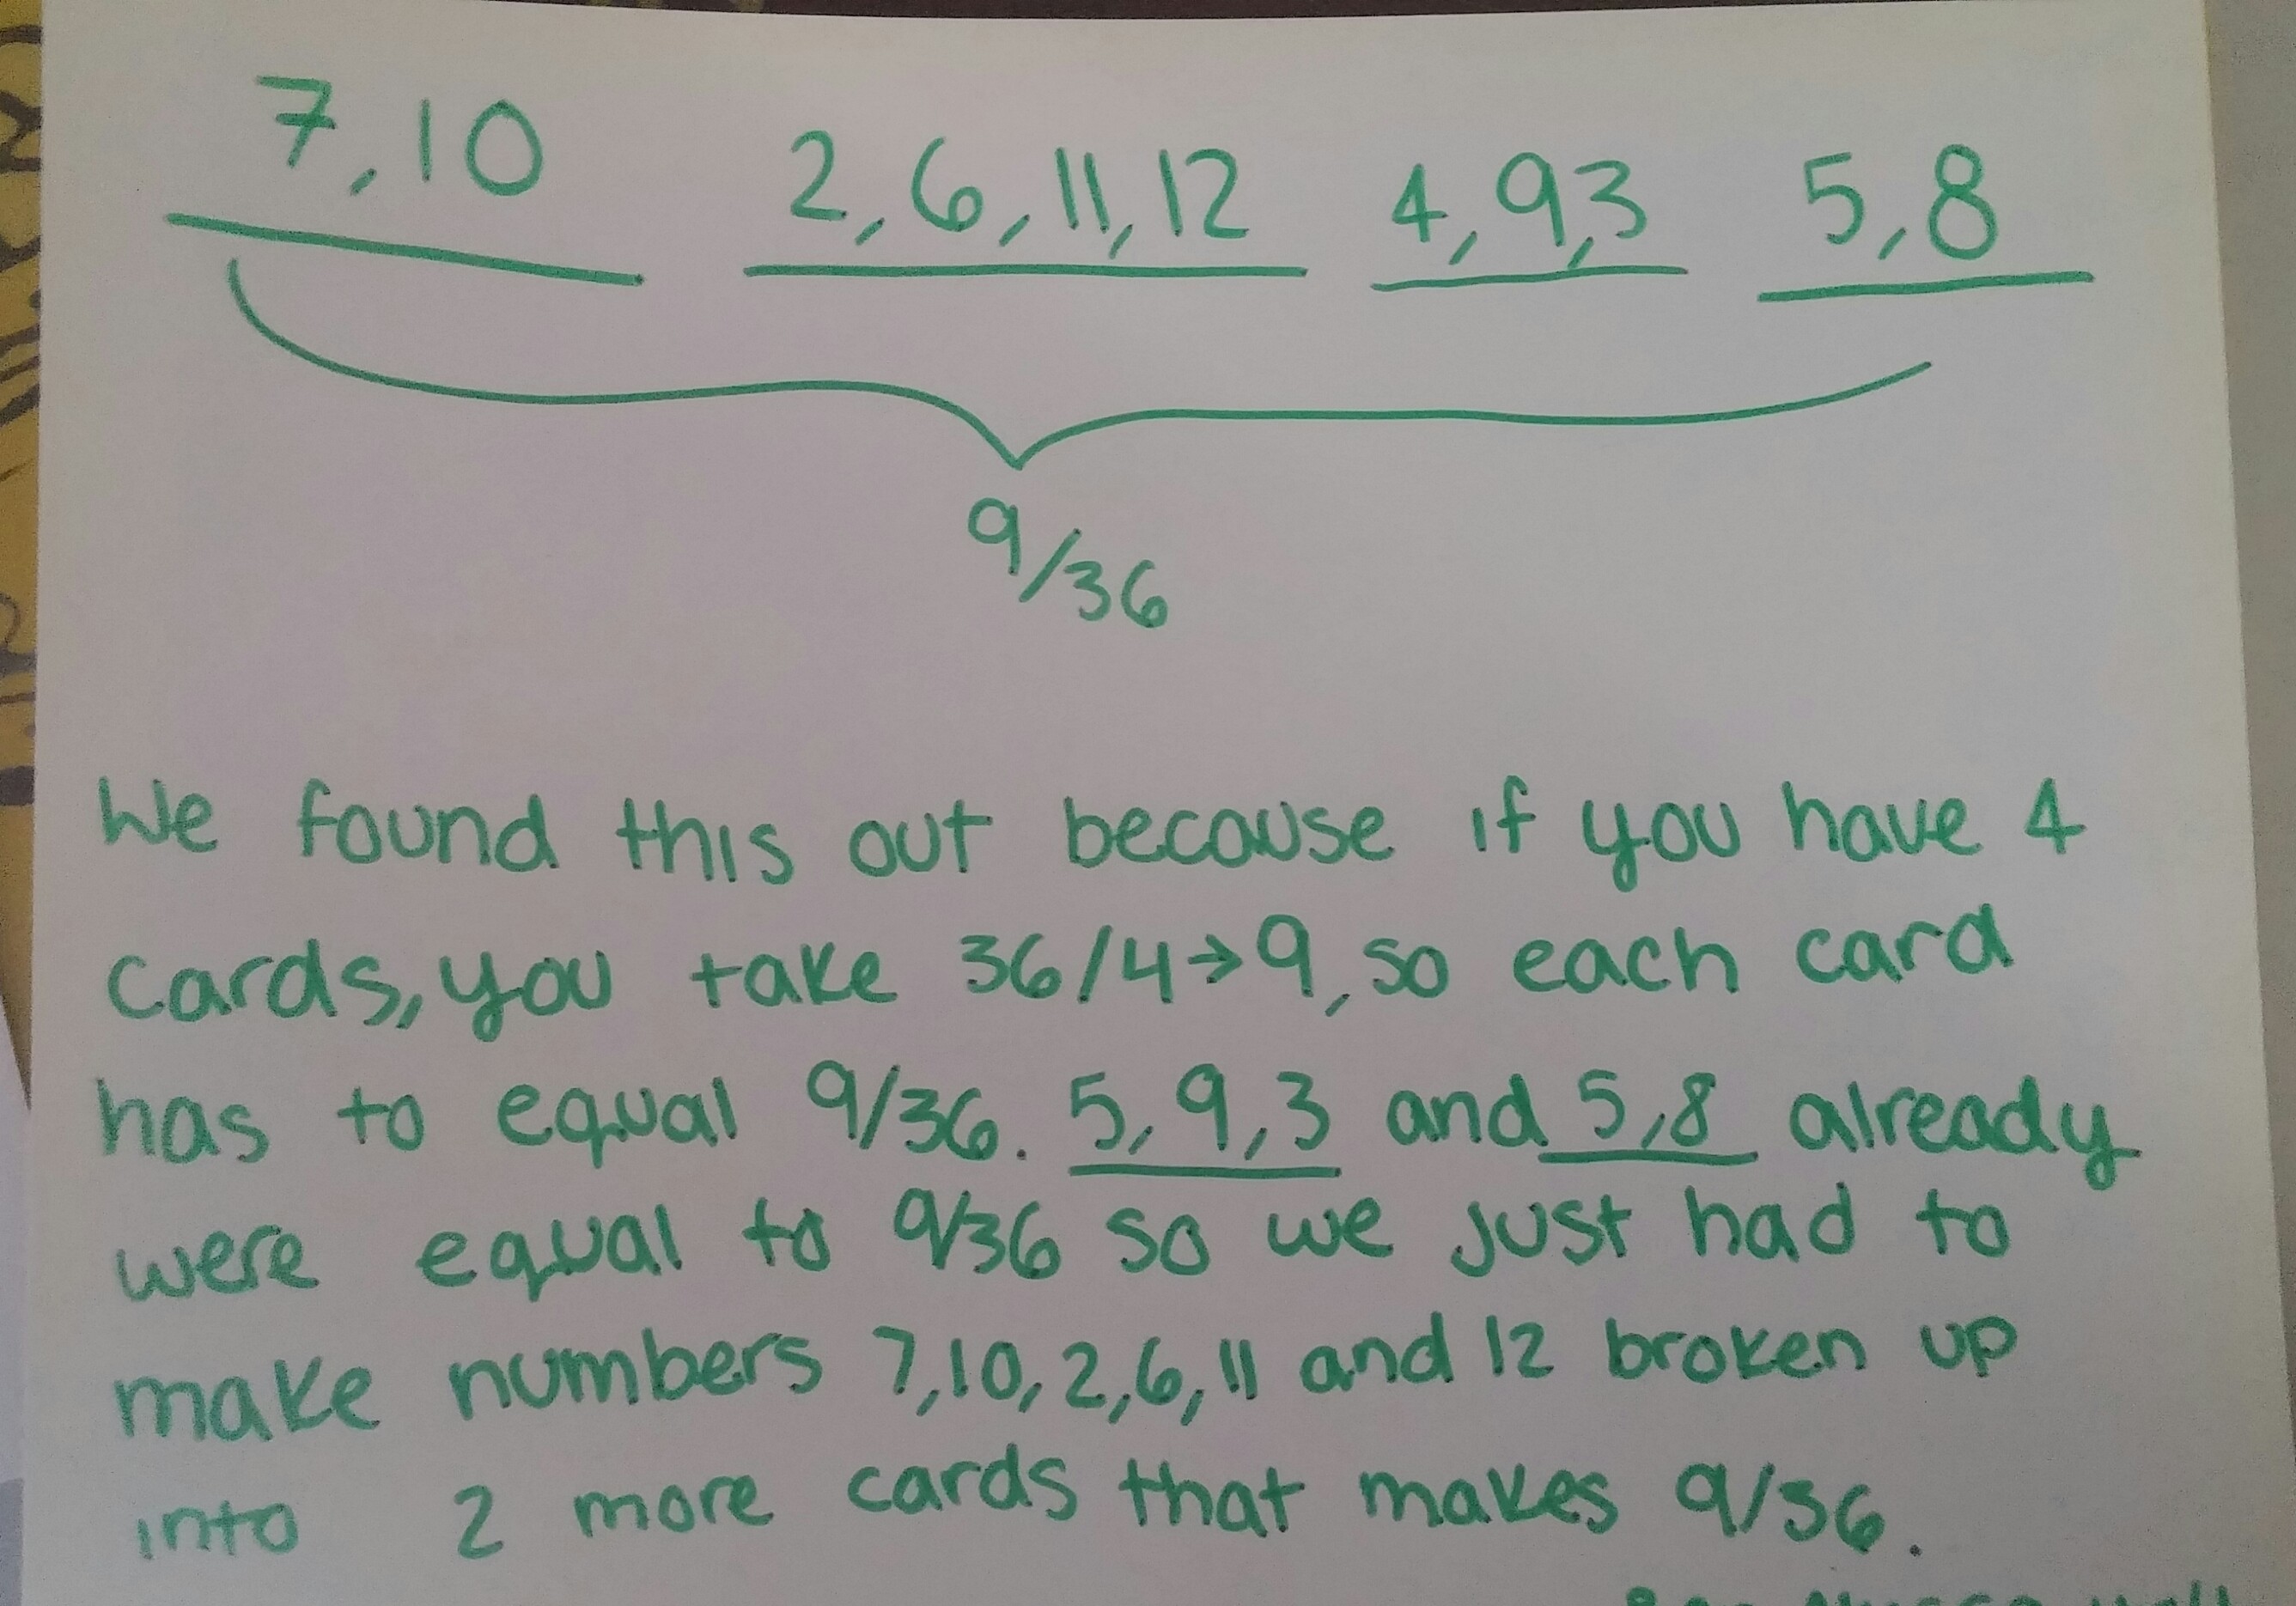
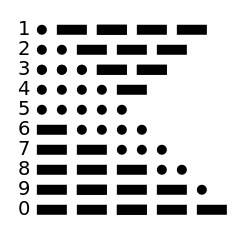
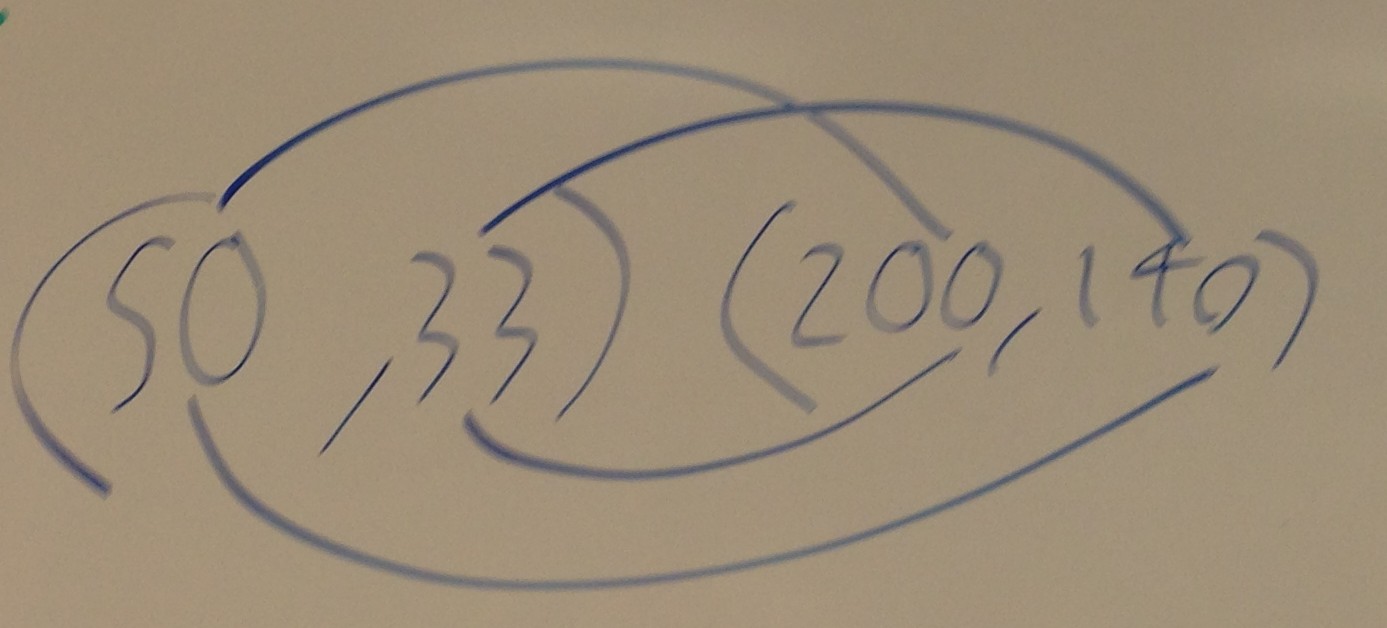
We started this yesterday.  They are in groups of 4; the oldest student in the group got to choose first and so on.  Then they played three “games” using a pair of dice and a whiteboard with their numbers on it.  Today, they worked on figuring out why the “6,7” card was the best and determining how to rearrange the numbers  on the cards to make them all equally likely to win.

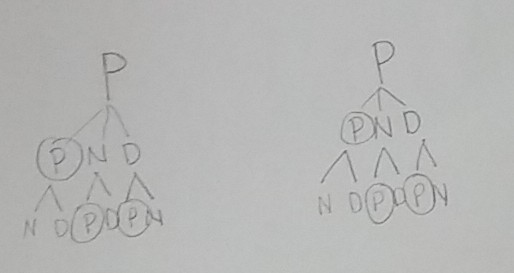
I’ve had this glossy paper in my room forever, so I decided to have them make a mini-poster with their solution and some reasoning.  Here are my two favorites:

0521151413a-1 0521151415a-1

Talking Pizza and Pennies

Today was a banner day in my ninth grade probability and statistics class.

First, our number talk was a bite out of the real-world and not the “you and 5 friends share 8 pizzas” kind of real-world.  When my daughter has a babysitter, as she did last night, I usually spring for pizza.  (Yes, our vegan lifestyle maintains a real iron-grip on nutrition when mom and dad are gone.)  I even splurge on the good stuff:  $5 Pizza.

With tax, my vegan-less vice cost $5.36.  I gave the cashier $20.11.  How much change did I receive?

Lots of great strategies:  counting up, counting down, counting to the middle even.  It’s worth noting that the two students in each class that insisted on stacking the numbers and borrowing were not able to do so correctly.  I say this not to discount the standard algorithm.  Rather I wish to point out that in this case, when it’s necessary to borrow three times, the standard algorithm is blatantly inefficient.

The students had to know why on earth I would give the cashier $20.11 rather than just $20.  The answer: Quarters.  Because if you’re at the store with a 4 year old and you do not have a quarter for a gumball machine, god help you.

The main portion of the lesson was the real magic. This problem is from Strength in Numbers by Ilana Horn:

Imagine that you have two pockets and that each pocket contains a penny, a nickel and a dime.  You reach in and remove one coin from each pocket.  Assume that for each pocket, the penny, the nickel, and the dime are equally likely to be removed.  What is the probability that your two coins will total exactly two cents?

They sit in groups of three or four.  I gave each group a large piece of paper, had them put a circle in the middle for their final solution and then divide the paper into 4 sections for their individual work.  When looking through my pictures of student work, I noticed that I have a tendency to capture correct work (but differing methods), but I do not take photos very often of incorrect work.  Today, I changed that.

Here is a sample of their strategies for determining the number of outcomes:

0519151329a 0519150944b 0519150943c 0519150943 0519150943b0519151329a

The level of discussion was exquisite.    But what’s more important was that they were able to work together to organize their thinking and to make sense of their solution.  They built on what they knew an gained conceptual understanding as a result.  In addition, they were able to focus on understanding their path to the solution rather than simply being satisfied with the solution itself.  I’m very proud of them.

Class: 9th grade prob and stats. Topic:  Linear regression.  Enter: the Laundry Data.

The data sheet seemed to spark a LOT of curiosity.  In retrospect, I wish I would have given them some time to Notice and Wonder about the detergents.  Probably I’d also add some estimation first about these bottles of detergent rather than just handing them the data.  I should have known better.

Still, an interesting discussion ensued about ounces of detergent and loads of laundry.  We plotted the points on Desmos and wanted to choose two of them to create our linear model.  I teach three sections of this class and all three classes picked different points to make their equation.

One class picked (50, 33) and (200, 140), and after determining that they needed to find the slope in order to write the equation of the line, I posed that question to them.  How would we find the slope between these two points.  Crickets.

I want to note that a good minute of silence and eye-contact avoidance went by before one brave student spoke up.

S:  You FOIL them.

Me:  Can you explain what you mean by that?

S:  (coming to the board) You multiply them like this.

IMG_5025

Me:  What do we think of what S just wrote up here?  (at least 8 hands shot up in the air)

Me:  Please put your hands down and let’s discuss this.  What I like about what S just did here is he got us started somewhere.  He was willing to take a guess and risk being wrong.  Before S showed us his idea, no one was willing to volunteer their method.  Now that S has broken the silence, lots of you seem ready to discuss.  Thank you S for starting us somewhere.

After this student broke the ice, we came up with about 4 ways to determine the slope of this line and about 8 ways overall to figure out the equation of the line between these two points.  In the past, I would have said to this student, “No, we don’t FOIL, who has another idea?”  Now I know that allowing this student to explain his method does multiple things.  First, it helps the other students practice patience and courtesy when listening and responding to this student whose solution they know is incorrect.  Second, it is a great opportunity for students to engage in SMP #3: Construct viable arguments and critique the reasoning of others.  Third, it provides an opportunity to praise the value in providing the wrong answer.  So much of math class for these students has been about getting the right answers.  I’m glad this teachable moment came about for students to learn from the wrong one.

Alright, Mr. Stadel. We’ve Got Some Bacon Questions

Greetings, Mr. Stadel.  We know that you are very busy.  We appreciate your brief attention.  Rather than bombard you with tweets, we decided to bloggly address our questions and comments about your Bacon Estimates.

First of all, bravo.  You dedicated an entire section of your estimation180 blog to a culinary wonder some refer to as “meat candy.”  Even our vegan teacher felt compelled to engage us with these estimates.  (She says it is for the sake of the learning.)

Second, the time lapse videos of the cooking are pretty sweet.  Too bad the school internet wouldn’t stop buffering.  But nice touch, Mr. Stadel.  Nice touch.

A question:  Did you know that the percent decrease in length of bacon is 38% after cooking, but the percent decrease in width is only 23%?  We figured that out adapting your “percent error” formula to the uncooked/cooked bacon.  Do you have any initial thoughts about that discrepancy?  Is it bacon’s “fibrous” fat/meat striped makeup that allows it to shrink more in length than width, inch for inch?

Also, did you know that the percent decrease in time from the cold skillet to the pre-heated skillet is 29%?  That one was a little harder for us to calculate, because we figured out that we needed to convert the cooking times to seconds rather than minutes and seconds.

To summarize, we wanted to thank you, Mr. Stadel.  Our teacher tells us that you dedicate your time and energy to the estimation180 site so that WE don’t have to learn math out of a textbook.  We wanted to tell you that we appreciate it.  And the bacon.  We appreciate the homage paid to bacon.

Sincerely,

Mrs. Schmidt’s Math Class

St. Francis, MN

Creative Craziness

I teach a lot of 9th graders this trimester. We offer a class called probability and statistics 9 and it is open to 9th grade students who also will have had the quadratic portion of algebra 1 this year. I really enjoy this class for multiple reasons. First, it lends itself very well to applying math to real-world scenarios.  Secondly, the hands-on opportunities are endless.
One of the issues I have been committed to improving with my own professional demeanor is the way I deal with 9th grade boys. Nothing brings out my sarcastic, short-tempered, disagreeable side like the antics of freshman boys. There’s something about the decision to play soccer with a recycling bin that just invokes the my inpatient side. Regardless, I need to develop more patience with this demographic. Boys are unique, both in the way that they act and the way that they perceive acceptable behavior. I’m not talking about “I’m bored” acting out. I’m talking about the “I really need to see if this eraser will fit in this kids ear” kind of acting out. I think that my short fuse has more to do with my failure on my part to  fully understand them rather than gross misbehavior on their part. What I’m really trying to grasp here is not “why can’t these kids sit still?” But more “when they can’t sit still, what makes them want to kick a recycle bin around the room or toss magnets at the learning target?” I think if I had a better understanding of what drives those behaviors, I could deal with them more productively. Suggestions?

Engaging with Engagement

High school students are inherently unpredictable. I’ve been told it’s the condition of their pre-frontal cortex and they can’t help it. I’m sometimes baffled and confused by what intrigues and engages them. If you’ve seen their obsessions with Snapchat, you know what I mean.
Something that always gets teenagers riled up, however, is a statement that challenges their peer group. In fact, I found today, that they’ll engage at a much higher level when presented with data that questions their level of engagement.

After a little guessing and estimating, I revealed this graph resulting from a recent Gallup poll on student engagement during my 9th grade statistics class today:

Gallup Graph

The kids were fired up right away.  Even if students agreed with the representation, it seemed as though every kid wanted to share his or her interpretation of how student engagement changes over time.  They shared their experiences from their formative years of education and respectfully expressed their frustrations for how much more difficult school gets each year.  Surprisingly, the students seemed to place blame for the overall decline in curriculum immersion on themselves.

Until one boy opened up the floodgates with the proclamation, “In elementary school we get to learn by messing around with stuff.  In high school, all we ever do is listen to the teacher talk and do boring worksheets.”  Expecting me to dismiss this kid’s comment for daring to suggest that the burden of student engagement also lies on the teacher, the class was relieved when I asked this student to expand on his thoughts. Almost simultaneously, multiple hands shot up in the air agreeing with this sad truth many of them were thinking and this young man had the courage to say out loud.  A rich, important, respectful discussion ensued about the difference between being busy in class copying, listening, and doing and being engrossed in activities that facilitate learning.

We continued the conversation by critiquing the methodology used to collect the data for this poll and the misleading representation in the graph.  Sorry, Gallup, my 9th graders spotted the flaw in the using in a self-selected study to represent all students right away.  They also debated the validity of broad categories such as “Elementary School” represented only by 5th graders rather than K – 5.

We discovered that the actual Gallup Student Poll is available online.  The students agreed that Friday was probably not a good day to do a survey about school engagement, but we’re really looking forward to collect and analyze the data on their classmates.

Correlation Investigation

A benefit of having advanced students for probability and statistics is that there is often a level of curiosity in the room that can drive an entire class period of discussion. Sometimes.
We were about to start a unit on linear modeling and correlation, and I decided to start with giving them the data and the best-fit line and then having them determine the correlation coefficient based on some examples. We used a data table of 21 common cereals, all with calories, sugar, fat, and carbs per 1 cup portion.
The students first were given time to notice and wonder and I had them determine what two columns of data were most closely correlated and least related. We came up with a list for both and then we started number crunching.
The NCTM website has a nice set of core math tools . The Java-based app lets you put in data and then will have students “guess” the correlation coefficient from a list of 4 choices. Some kids made conjectures about how correlation coefficients were calculated. Others refuted these with counter examples. It was a beautiful discussion. In the process, we compiled the correlation coefficient for all of the data sets and this answering our other question about which sets were most and least related.
Finally, I set them off on the map shell lesson about devising a method for measuring correlation. This was just the intro to this lesson. The real fun started the next day…