But Would You Put Money On It?

I have felt one of two extremes every day this school year:

  1. My students aren’t learning anything meaningful, it’s impossible to do everything I need to do well, and my brain is on fire.
  2. Cheers!  My students had fun while making meaningful mathematical connections.

Today was the latter kind of day so I thought I’d take a few moments to embrace it.

I proposed this scenario to my non-AP probability and statistics class:

Doubles Dilemma (1)

I had students discuss their initial reactions.  Many of them mentioned specifics like “1 out of 6” and “36 possibilities” but for the most part, the students were willing to put their hard earned money on the line for a chance at avoiding doubles.  (To be clear, no actual betting went on in my classroom)

Then we rolled until we got doubles.  And rolled again and again and again.  I have one computer and a class set of TI-84s.  So, naturally, we made a class dot plot of our average number of rolls to get doubles.

wpid-1029151423-1.jpgwpid-1029150825-1.jpg


Now that our data was collected, I asked them again if they would take the bet.  Since $5 didn’t seem to be enough money for them to really consider the probability, I upped the wager to $100.  That seemed to be enough money for them to consider the results of the experiment and think twice about putting up $100 because they feel lucky.

Thanks to Chris True, Mathematics Professor at the University of Nebraska, who proposed this scenario at an AP Statistics training I attended this summer.


Bingo Lingo

This time of year, the standards used to measure the success of a lesson may look different than they do at other times of the year.  For example, some teachers might consider “Students not using worksheets to have paper airplane throwing contest” to consistute a lesson well executed.  To a certain extent, I am joking, but there’s a thread of reality there.   Think back to a time when your excitement for a future event prevented you from doing anything productive.  Now imagine leading a room full of 32 people with that same excitement and handing them a manual for their new scanner/copier.  You get the idea.

I can usually distinguish between my being pleased with a lesson based on lowered expectations and my being pleased with a lesson because of a high level of learning and collaboration.  Today was the latter, with my 9th grade probability and statistics class again.

I found this on Don Steward’s website.  If you have seen his blog and are not fascinated, or at least intrigued, we cannot be friends.  He comes up with some amazingly simple, yet elegant classroom problems.

Picture1  Picture2 Picture3


We started this yesterday.  They are in groups of 4; the oldest student in the group got to choose first and so on.  Then they played three “games” using a pair of dice and a whiteboard with their numbers on it.  Today, they worked on figuring out why the “6,7” card was the best and determining how to rearrange the numbers  on the cards to make them all equally likely to win.

I’ve had this glossy paper in my room forever, so I decided to have them make a mini-poster with their solution and some reasoning.  Here are my two favorites:

0521151413a-1 0521151415a-1

Talking Pizza and Pennies

Today was a banner day in my ninth grade probability and statistics class.

First, our number talk was a bite out of the real-world and not the “you and 5 friends share 8 pizzas” kind of real-world.  When my daughter has a babysitter, as she did last night, I usually spring for pizza.  (Yes, our vegan lifestyle maintains a real iron-grip on nutrition when mom and dad are gone.)  I even splurge on the good stuff:  $5 Pizza.

With tax, my vegan-less vice cost $5.36.  I gave the cashier $20.11.  How much change did I receive?

Lots of great strategies:  counting up, counting down, counting to the middle even.  It’s worth noting that the two students in each class that insisted on stacking the numbers and borrowing were not able to do so correctly.  I say this not to discount the standard algorithm.  Rather I wish to point out that in this case, when it’s necessary to borrow three times, the standard algorithm is blatantly inefficient.

The students had to know why on earth I would give the cashier $20.11 rather than just $20.  The answer: Quarters.  Because if you’re at the store with a 4 year old and you do not have a quarter for a gumball machine, god help you.

The main portion of the lesson was the real magic. This problem is from Strength in Numbers by Ilana Horn:

Imagine that you have two pockets and that each pocket contains a penny, a nickel and a dime.  You reach in and remove one coin from each pocket.  Assume that for each pocket, the penny, the nickel, and the dime are equally likely to be removed.  What is the probability that your two coins will total exactly two cents?

They sit in groups of three or four.  I gave each group a large piece of paper, had them put a circle in the middle for their final solution and then divide the paper into 4 sections for their individual work.  When looking through my pictures of student work, I noticed that I have a tendency to capture correct work (but differing methods), but I do not take photos very often of incorrect work.  Today, I changed that.

Here is a sample of their strategies for determining the number of outcomes:

0519151329a 0519150944b 0519150943c 0519150943 0519150943b0519151329a

The level of discussion was exquisite.    But what’s more important was that they were able to work together to organize their thinking and to make sense of their solution.  They built on what they knew an gained conceptual understanding as a result.  In addition, they were able to focus on understanding their path to the solution rather than simply being satisfied with the solution itself.  I’m very proud of them.

Probability Ponderings

It’s been a great week in my probability and statistics classes.  I’m not sure why I’m pleasantly surprised.  This time of year it’s absolutely essential that we engage kids in meaningful mathematics and when we do, they respond well.

Monday, we did expected value and Dan Meyer’s Money Duck.  See Monday’s blog post for details.  Extra Credit if you can find my duck pun in there.

Tuesday, after assessing expected value, we moved to tree diagrams and conditional probability.

Wednesday, I used Nrich’s In a Box problem to create some discussion about dependent and independent events.  

I started with a bag with unifix cubes and had them do some experimenting to see if the game was fair.  What I love about this problem is that the initial answers that the kids come up with are usually completely wrong.  It really allows the teacher to identify the misconceptions.  Additionally, this problem is so easy to extend.  Simply have the students come up with a scenario of ribbons that creates a fair game.  Most will come up with something like 2 red and 2 blue. Have them test their theory, find out it’s wrong and then test another.  Even when they find the magic combination that creates a fair game, there is still the task of generalizing the results that’s challenging.     

Thursday, I totally stole Andrew Stadel’s 4! lesson.  What a great intro to the idea of factorial.  Last trimester I used IMP’s ice cream bowls and cones, which I still might refer to.  I felt like having a few students up in front at the beginning got everyone on the same page at the same time.  It was completely awesome to see the different methods for solving this.  I love the repeated reasoning here:

photo

Plus, opportunities to use animal counters in HS math are scarce.

What’s the most pleasing about this week is that I think that this group’s conceptual foundation of these concepts is more solid than it has been in any previous year.  We still have practice to do, but I feel like they have made a good connection to what their answers represent.  In the past, my formula driven instruction didn’t bode well for retention of the concepts. I’m more hopeful this time around.

Duck, Duck, Money Duck

When I moved to Minnesota, I learned a new game called Duck, Duck, Gray Duck.  This is similar to the game that the rest of the country cleverly calls “Duck, Duck, Goose.”  Evidently, in Minnesota, as you are tapping heads, you can call out absurdities such as purple duck or yellow duck.  Listening skills at work here; gray duck is the magic color.

[The preceding paragraph has nothing to do with this post, but if you’ve always wondered why Minnesota boasts Duck, Duck, Gray Duck rather than conforming to the rest of the country, now you know.]

Speaking of ducks, Dan Meyer’s newest three-act lesson was coincidentally timely with my probability and statistics progression.  Today’s learning target included expected value, so I thought we’d give it a go.

Act 1, Initial Questions:

  • Can you actually buy one of those?
  • Is that like the diamond ring candles?
  • Do any of them have $50, for real?
  • Would it be worth it to buy a bunch to get the $50?
  • How much do those things cost?

I had them speculate a fair price for one of these duck soaps.  We had a discussion about what was meant by “fair” which was productive.  Most students settled on a price between $3 and $20.  The students also wanted to consider if shipping was included in our pricing.  Since we were looking at the price from the Seller’s point of view, it made us wonder if the shipping for Amazon Prime products is passed along to the seller or absorbed by Amazon.  We’ll have to address that another day.

Notables in Act 2:

1.  When deciding which probability distributions were impossible, students were quick to point fingers at E and F.

moneyduck2.002


After making the connection that the total of all bars must equal one, most students were able to identify B and C as impossible.  Arguments ensued over D about whether the two bars would total 1.  The ruler confirmed that indeed the bars did not add up to 1.

2.  When looking at these distributions and determining how a $5 duck would be bad for business, my students noticed something interesting.

IMG_5283IMG_5284IMG_5285

We had some great conversation about which would be worse:  losing customers from a faulty product or losing money with too many rich ducks.

3.  When determining fair prices for these distributions, I was impressed with my class’s use of an area model.  I sometimes supplement the probability unit with activities from IMP’s The Game of Pig and liked their application of a ruggish diagram here.  This allowed for a more fluid connection between the value of the duck bill and the probability of that payout.

moneyduck2.004IMG_5282


These are 9th graders, so only a few requested the sequel.    Overall, I was pleased with the outcome of this lesson.  I feel like the the money duck grabbed their attention more than previous attempts at real-world expected values such as pull-tabs or roulette.  I think the kids felt like soapy money is something they can access, and I think their attention to the task reflected that.


Buried Bias

Another provocative post coming at you.  You’ve been warned.

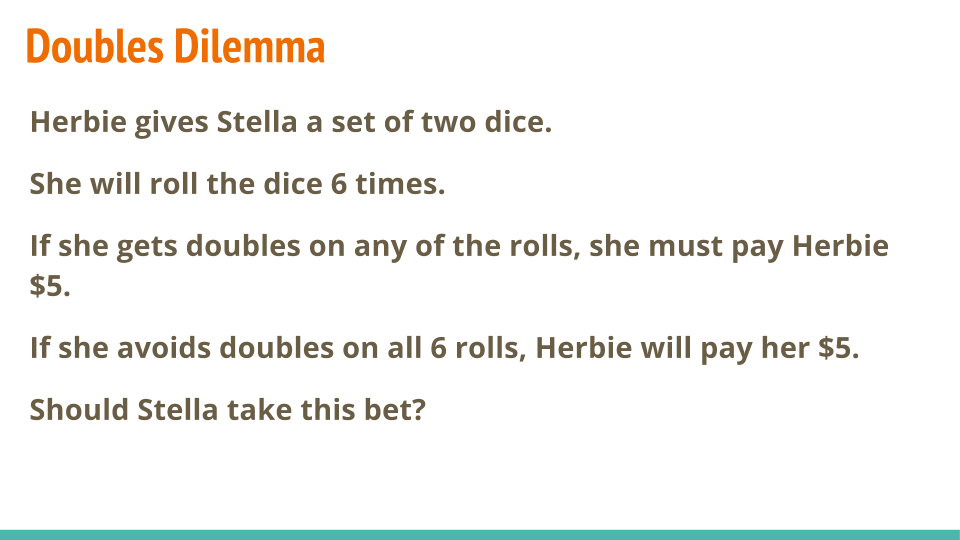
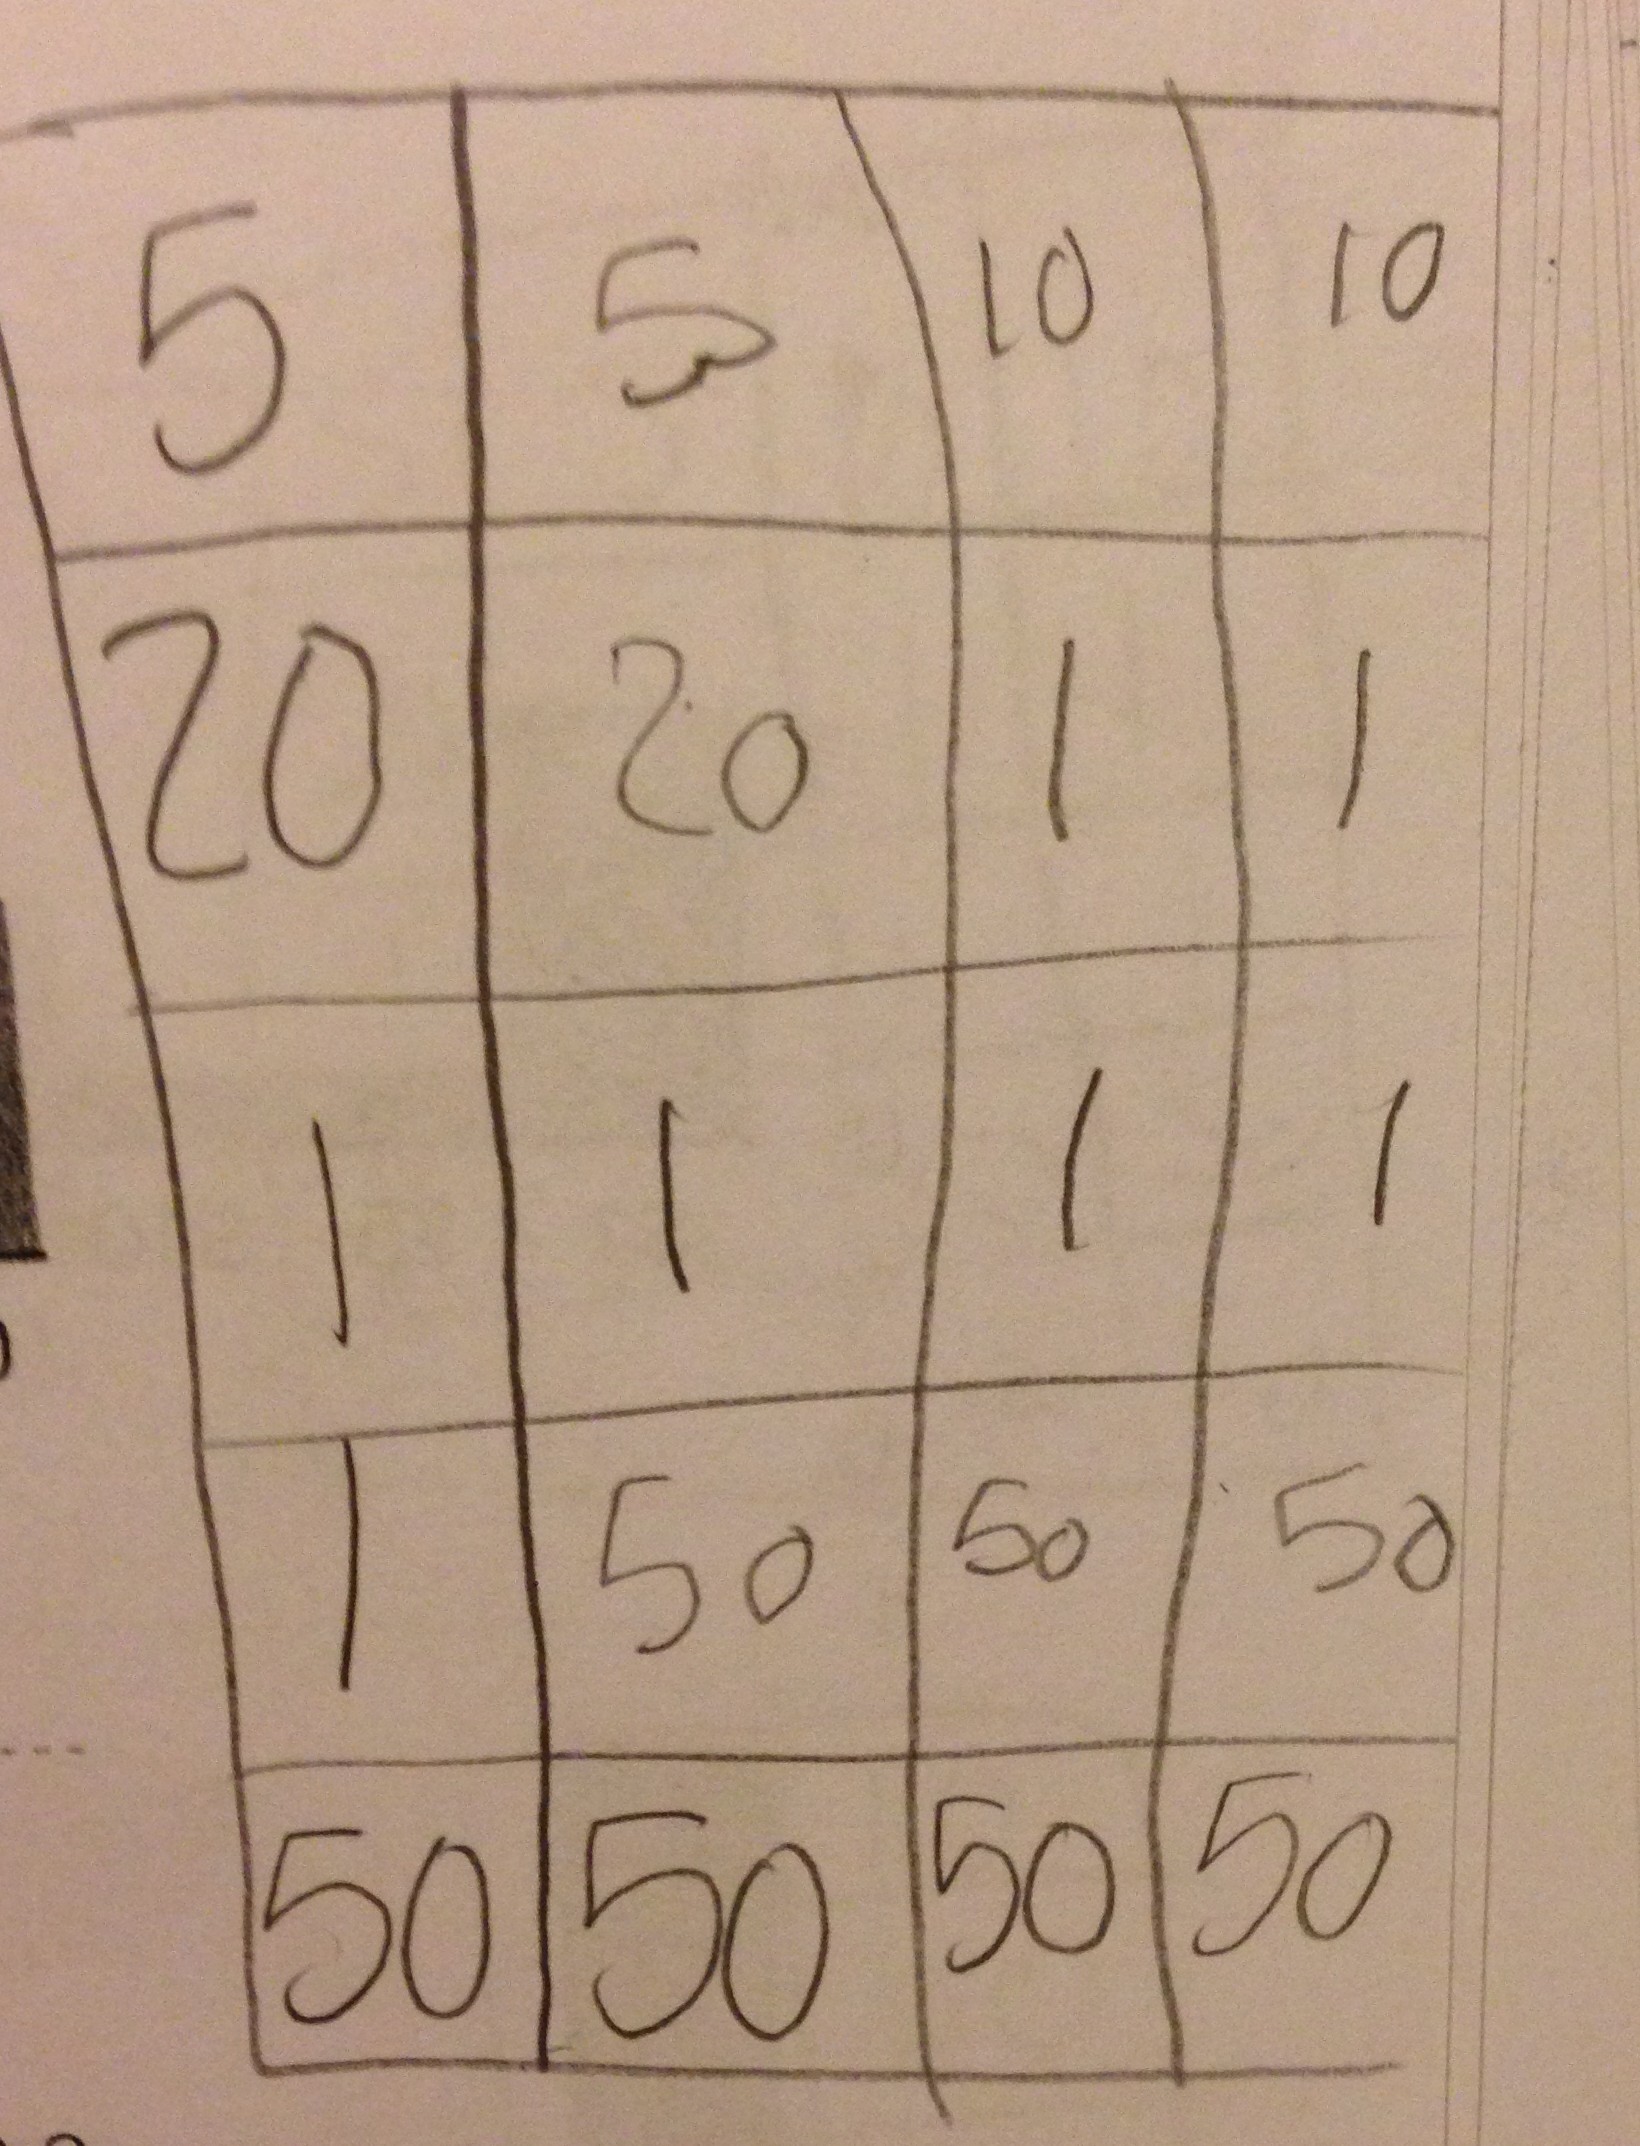
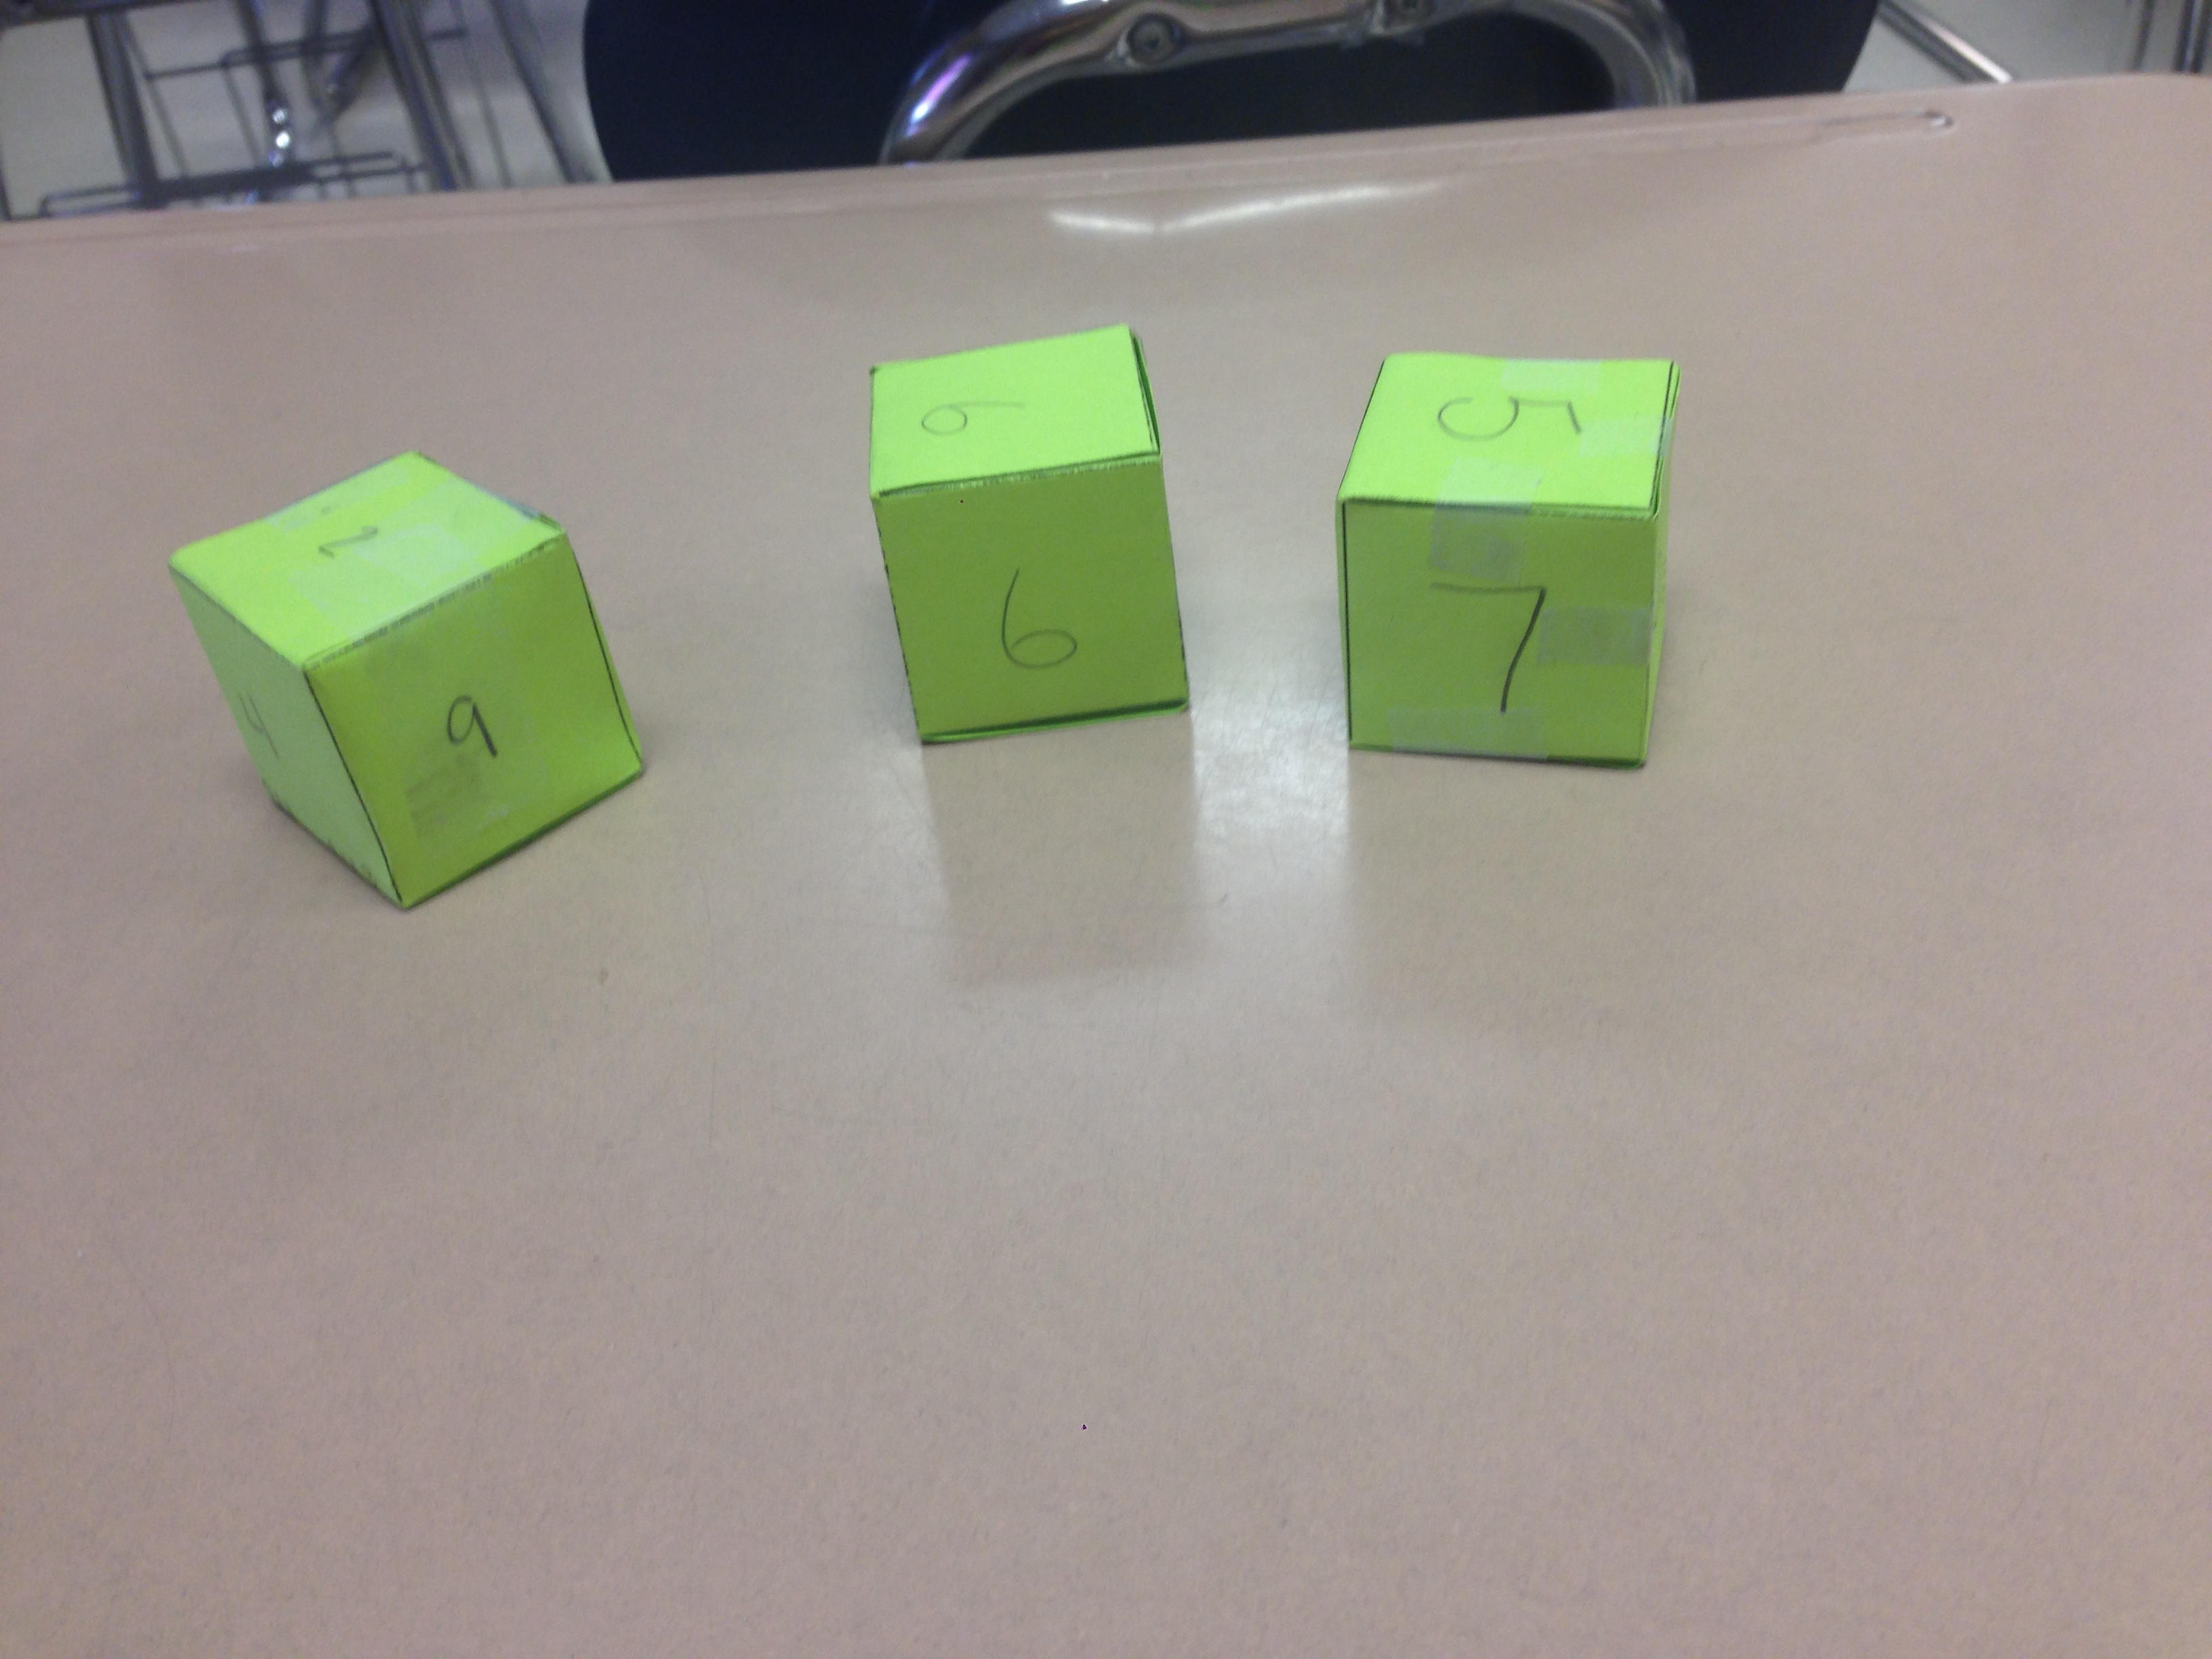
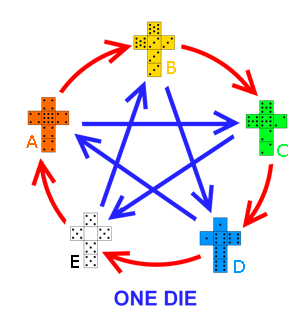
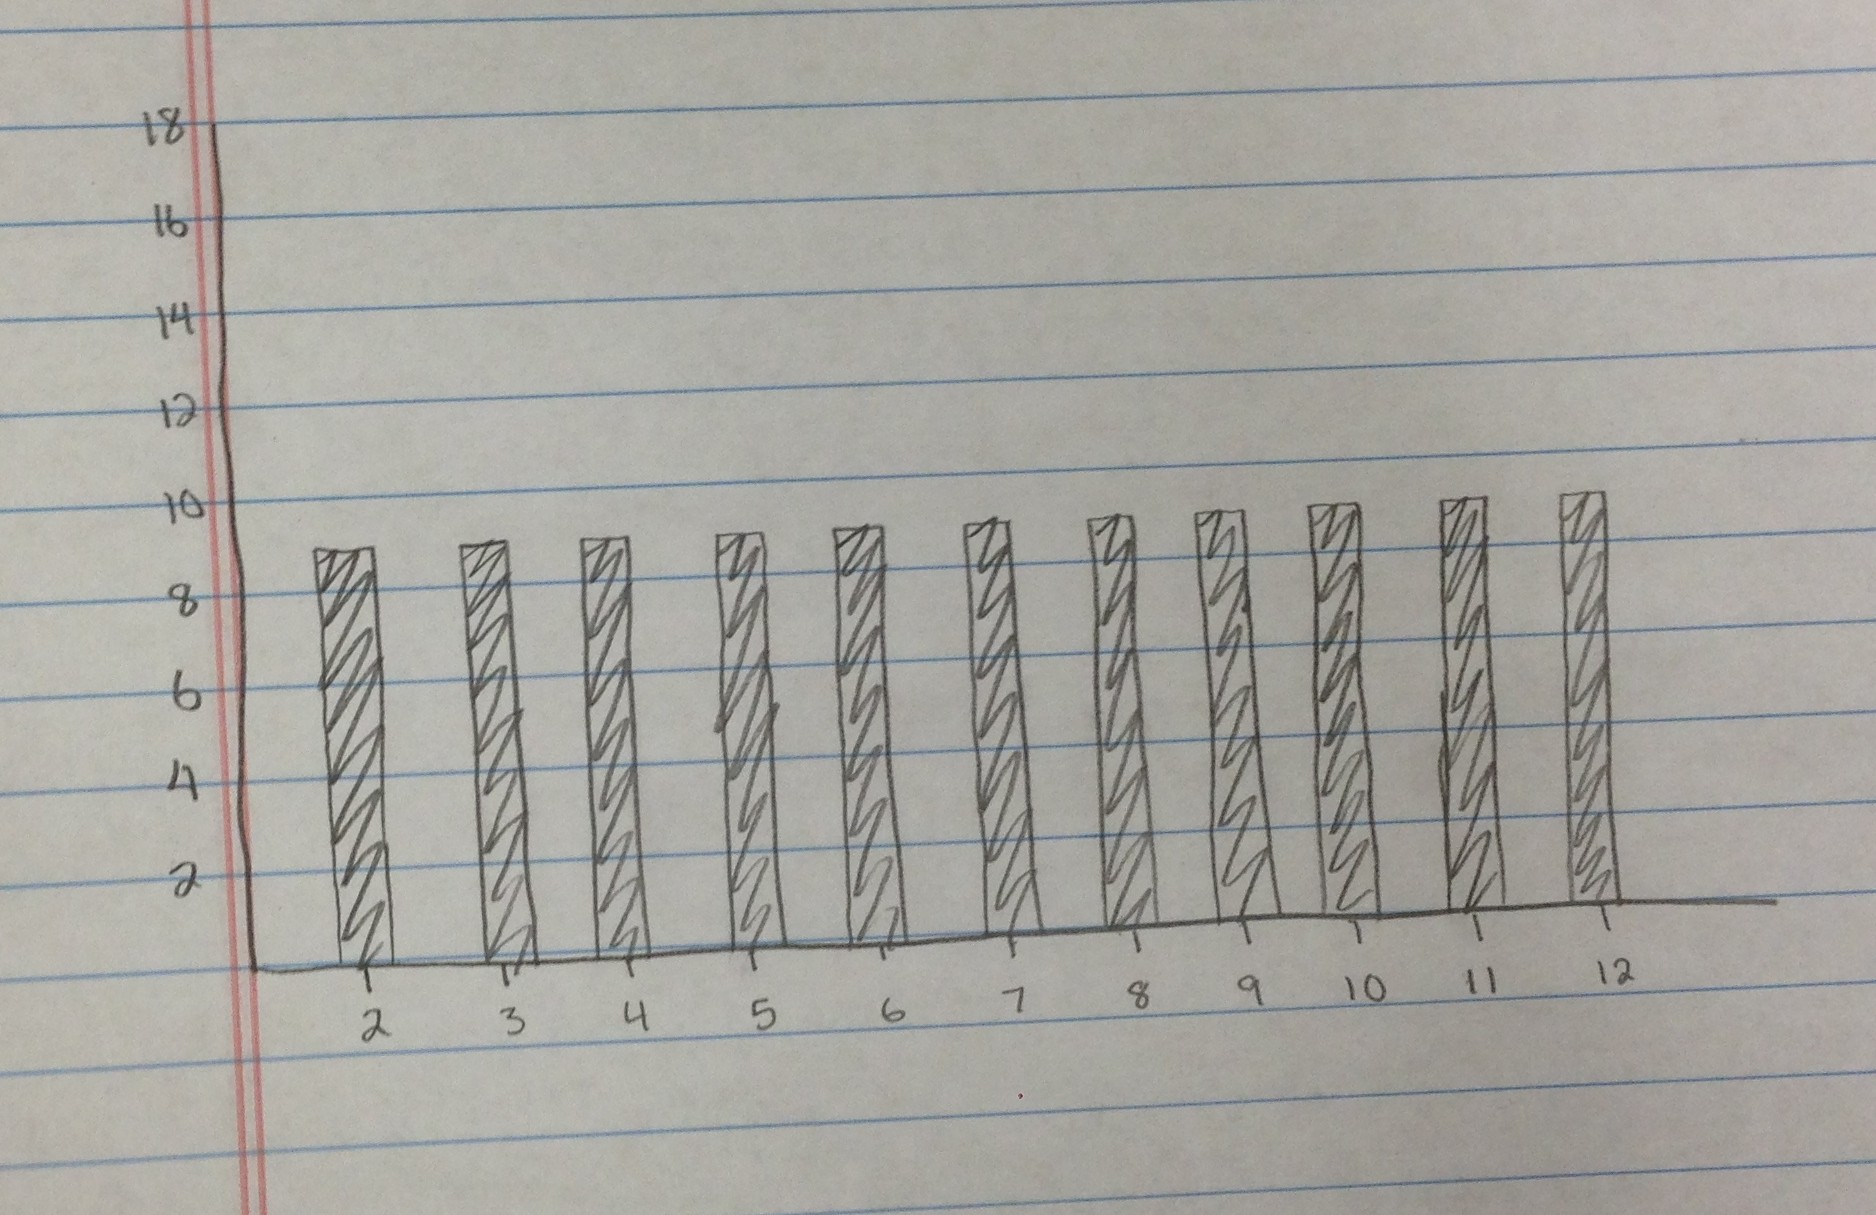
Probability and Statistics classes always rejoice on the days that I teach them how to play dice games.  Today it was Pirate’s Dice (or Liar’s Dice).  I love using this game because it’s simple to learn, fun to play, and actually requires the use of probability rather than just luck.  I found this article in NCTM from December 2012 and have modeled my activity after theirs.  That article is behind a paywall, so this link will tell you how to play the game if you are interested.

Overall, the student’s enjoyed the game and most of them got into it.  I had to move a few groups away from the shared wall because they got a little too excited, but overall, I felt like my goal for them was reached.  Most of them used probability to create a strategy to help them win.  I had lots of students tell me that the game was fun, so you’d think I would just close the week and move on.

Here was the problem:  in one of my classes, I had a group of students who barely participated.  They were in groups of their choosing, alleviating the idea that they can’t work together.  They positioned themselves in the back corner and once I was off helping another group, all members promptly dug their faces into their phones, texting, tweeting, and snapchatting away as if they were sitting in the cafeteria rather than math class.

I definitely could have handled the situation better because I got MAD at these kids.  Not yelling (because I don’t yell ever), but angry, defensive, and accusatory.  They got back to work.  Sort of.

I stepped back from what just happened to assess why their actions set me off in such a way.  A few other kids were on and off their phones when it wasn’t their turn to bid, and I wasn’t angry at them.  Was it perhaps because it was an entire group of 6 people that were disengaged?  An easier target?

I’ve had enough psychotherapy to know that  this had little to do with the fact that those kids weren’t playing as directed.  This had to do with the fact that this group of kids were the “cool kids.”  These were the popular, tons-of-friends, high-status 9th graders who always have a place to sit at lunch, who have a locker in the center of the hallway, and who would have never given a kid like me the time of day in high school.

Nailed it.  My frustration and resentment toward this group of kids had more to do with how I was treated by their “type” when I was in high school than their inappropriate behavior at that moment. In fact, had I nicely told them to get back to work, who knows, they might have happily complied.  Maybe not, but that’s not the point.  The point is that I didn’t give them that opportunity because my reaction was out of emotions from my high school experience.

I don’t do this often, and I’m glad I recognized it right away.  Right or wrong, these kids deserve a teacher that fairly and consistently applies her classroom management philosophies.  And students shouldn’t have to bear the brunt of their teacher’s lasting scars from a high school experience. I’m glad I’m aware enough to recognize this and change my actions.

Dice Wars

Nrich has an interesting activity called “Non-transitive Dice” that I’ve always wanted to use in my probability and statistics class.  I’m intrigued by the relationship between the strategy in choosing a dice and the probability of winning with that dice.

We don’t have blank dice, so I had my students make their own with cardstock.

IMG_5239


Initially, I had them choose which dice would win overall.  Then we let the rolling begin:  A vs. B, B vs. C, and C vs. A.  As they collected their data, they started predicting which dice would end up on top after battle.

Tomorrow, I’d like to sum up the probability representations of some of the dice match-ups.  I found this nice post by James Grime (yep, the Numberphile chap) with a few varieties of non-transitive dice.  Next year, I might start with his Grime set and have students collect data on different matchups.

If we are successful, hopefully we can workout the probability of these outcomes.

And finally, I know that my students will want to compare this dice game to Rock – Paper – Scissors – Lizard – Spock.

I kept digging into James Grime’s rabbit hole and realized, you can purchase this set of non-transitive dice.  Skippy.  I might do that!

Give Me Sum Dice.

Prompt:  You are rolling the dice 99 times and finding the sum on the dice each time.  Make a graph showing your prediction of the results.

I’m not sure why every year I think that most of the students will know ahead of time that 6, 7, and 8 come up most often.  Of course, the activity is more fun given that they don’t have a clue what’s going to happen.

Uniform

Uniform

Uniformly Random

Uniformly Random


Just Random

Just Random

Peak in Center

Peak in Center

I ask the kids if there are any other strategies for their predictions other than the ones we have discussed.  One student added that maybe 2 would show up least often and 12 the most, increasing in between.  Discussion ensued.

It’s fascinating to me to actually see the students discover what happens and why.  I used to have them use the probability simulator on the TI-83/84 but I just don’t trust TI to do anything random anymore.  Plus, there’s something more “real” about actually rolling the dice.

They then can compare the graphs of their predictions to their results and discuss differences and reasons for them.  IMG_5215

A question that blew me over today:  If we roll two dice over and over, which will happen first  –  a.  rolling a sum of 7, sixteen times,  or   b.  rolling 100 times altogether?  

I’m wondering , in a class of 30, what the aggregate results will be on this mystery question.


If you’re decently competent in the area of probability, you might know that your chances of winning fall below things like “death from a vending machine” and “having identical quadruplets.”  This doesn’t stop many people from playing.  I think playing the lottery is more about the chance to dream of what our lives would be like with that much money rather than actually believing we could win.

In the UK, the lottery consists of picking 6 numbers between 1 and 49.  Any player to match all 6 numbers is the grand prize winner.  The chances of this are certainly astronomically low.  A fun question to ask a class of students:  If we bought a lottery ticket for every different combination of 6 numbers to ensure we’d win, how high would that stack of tickets reach?

In the task Do You Feel Lucky, Nrich tackles the idea of evaluating advice given on raising your chances of winning this seemingly impossible lottery. Students are asked to comment on the validity of the advice given and one in particular caught my eye:

When picking lottery numbers, choose numbers that sum between 100 and 200 because the total is rarely outside this range.  

Whoa.  There are so many ways we could evaluate the validity of that claim.  So I sent my students off to the races. Most of them wanted to use a random integer selector and then gather the data from the class’s trials.

IMG_5135

GeoGebra Results:

Lottery

Lots for them to talk about here.  Lots of questions for them to ask as well.  Does the range seem too wide?  Do we have enough trials?  What do we make of the dip in the middle?  Should we change the bar graph to have different class sizes?  Would a box plot have been more appropriate?  What about the descriptive statistics?  Would those help us out?

I’m hoping next year to extend this into more of a class activity rather than an impromptu discussion.


My #MCTM Sub Stuff

Today my students will have a sub since I am attending our state’s math teacher conference (#mctm). Given the overall success of our Desmos Carnival activity from Monday, I decided that a computer lab activity might be fitting. Since we are starting a unit on probability, I took the opportunity to use some Nrich probability simulations.
I’m also attempting something new with Google Forms. I’ve observed my colleague, Dianna Hazelton, incorporate Google Forms, Sheets, and Docs quite seamlessly into her trigonometry and prob/stat classes. Her success with these apps made me eager to try them out as well. I like that I’m able to “see” what they did via the google form responses right away rather than have a pile of papers waiting for me on Monday.