If you’re decently competent in the area of probability, you might know that your chances of winning fall below things like “death from a vending machine” and “having identical quadruplets.” This doesn’t stop many people from playing. I think playing the lottery is more about the chance to dream of what our lives would be like with that much money rather than actually believing we could win.
In the UK, the lottery consists of picking 6 numbers between 1 and 49. Any player to match all 6 numbers is the grand prize winner. The chances of this are certainly astronomically low. A fun question to ask a class of students: If we bought a lottery ticket for every different combination of 6 numbers to ensure we’d win, how high would that stack of tickets reach?
In the task Do You Feel Lucky, Nrich tackles the idea of evaluating advice given on raising your chances of winning this seemingly impossible lottery. Students are asked to comment on the validity of the advice given and one in particular caught my eye:
When picking lottery numbers, choose numbers that sum between 100 and 200 because the total is rarely outside this range.
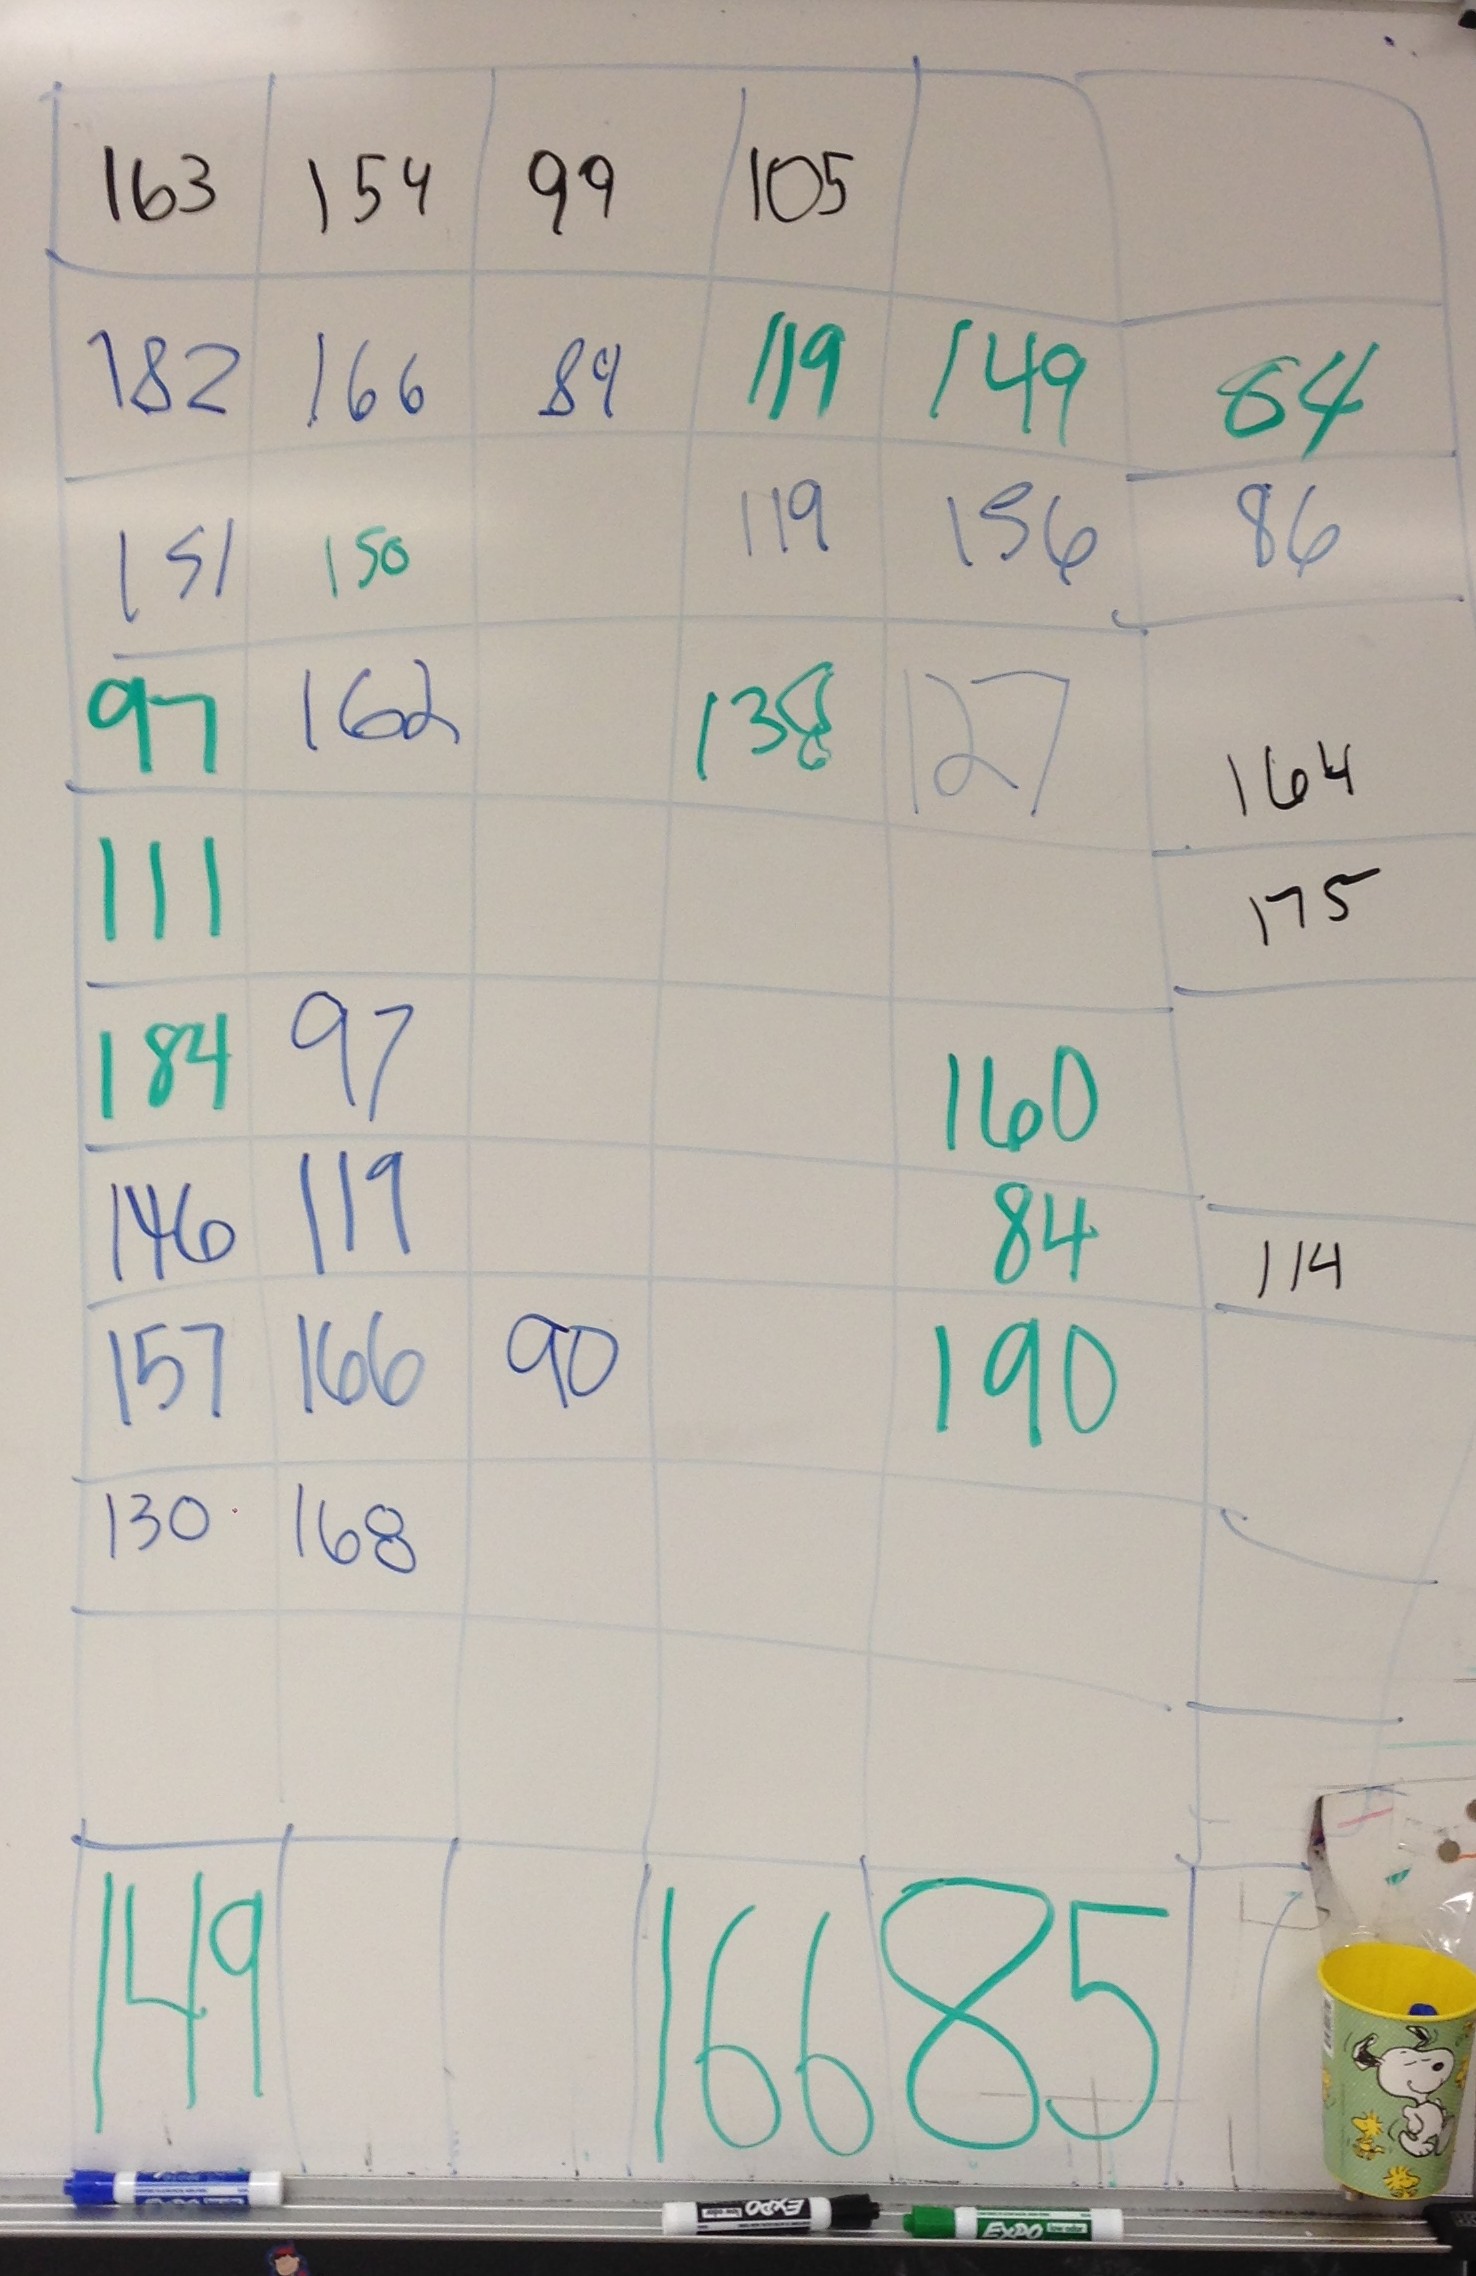
Whoa. There are so many ways we could evaluate the validity of that claim. So I sent my students off to the races. Most of them wanted to use a random integer selector and then gather the data from the class’s trials.
GeoGebra Results:

Lots for them to talk about here. Lots of questions for them to ask as well. Does the range seem too wide? Do we have enough trials? What do we make of the dip in the middle? Should we change the bar graph to have different class sizes? Would a box plot have been more appropriate? What about the descriptive statistics? Would those help us out?
I’m hoping next year to extend this into more of a class activity rather than an impromptu discussion.
