Prompt: You are rolling the dice 99 times and finding the sum on the dice each time. Make a graph showing your prediction of the results.
I’m not sure why every year I think that most of the students will know ahead of time that 6, 7, and 8 come up most often. Of course, the activity is more fun given that they don’t have a clue what’s going to happen.
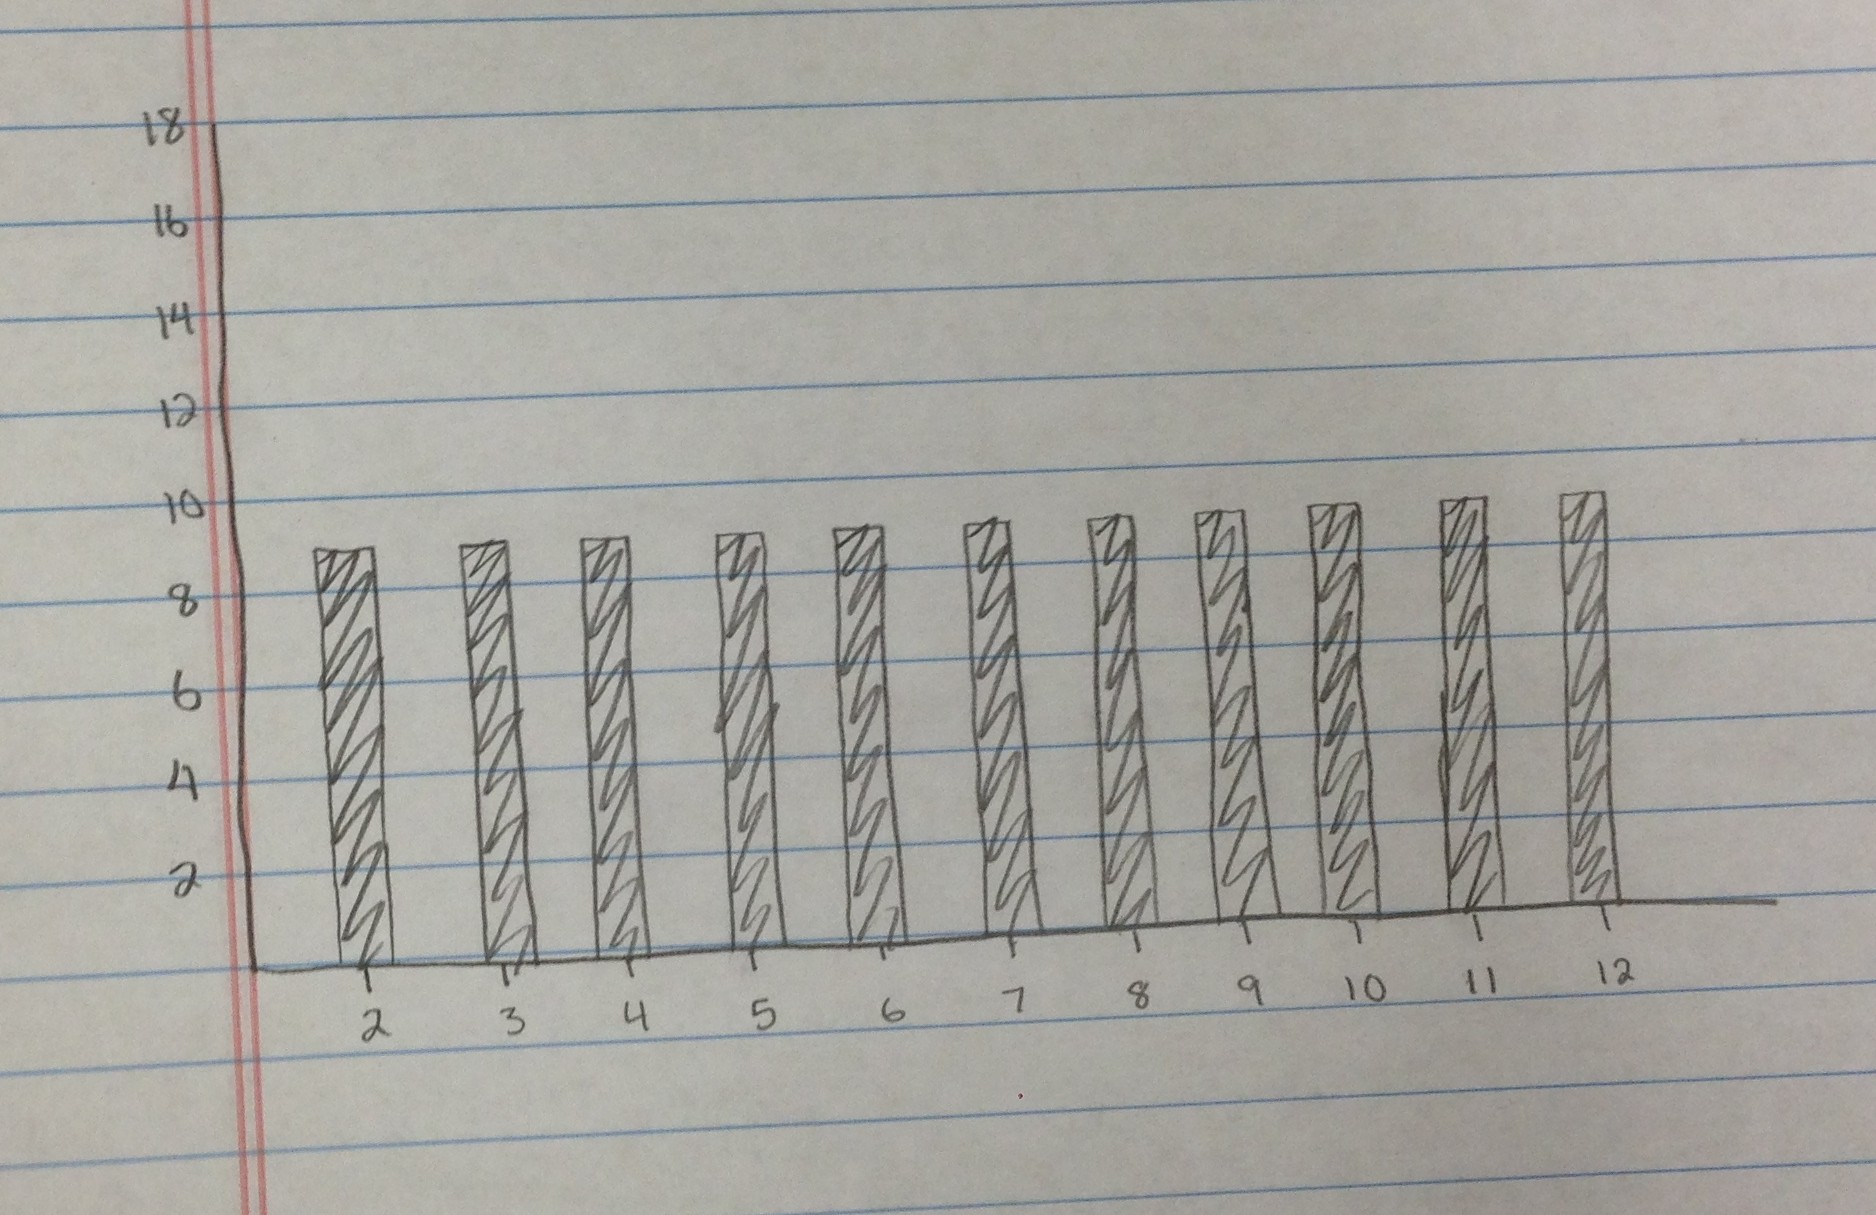
Uniform
Uniformly Random
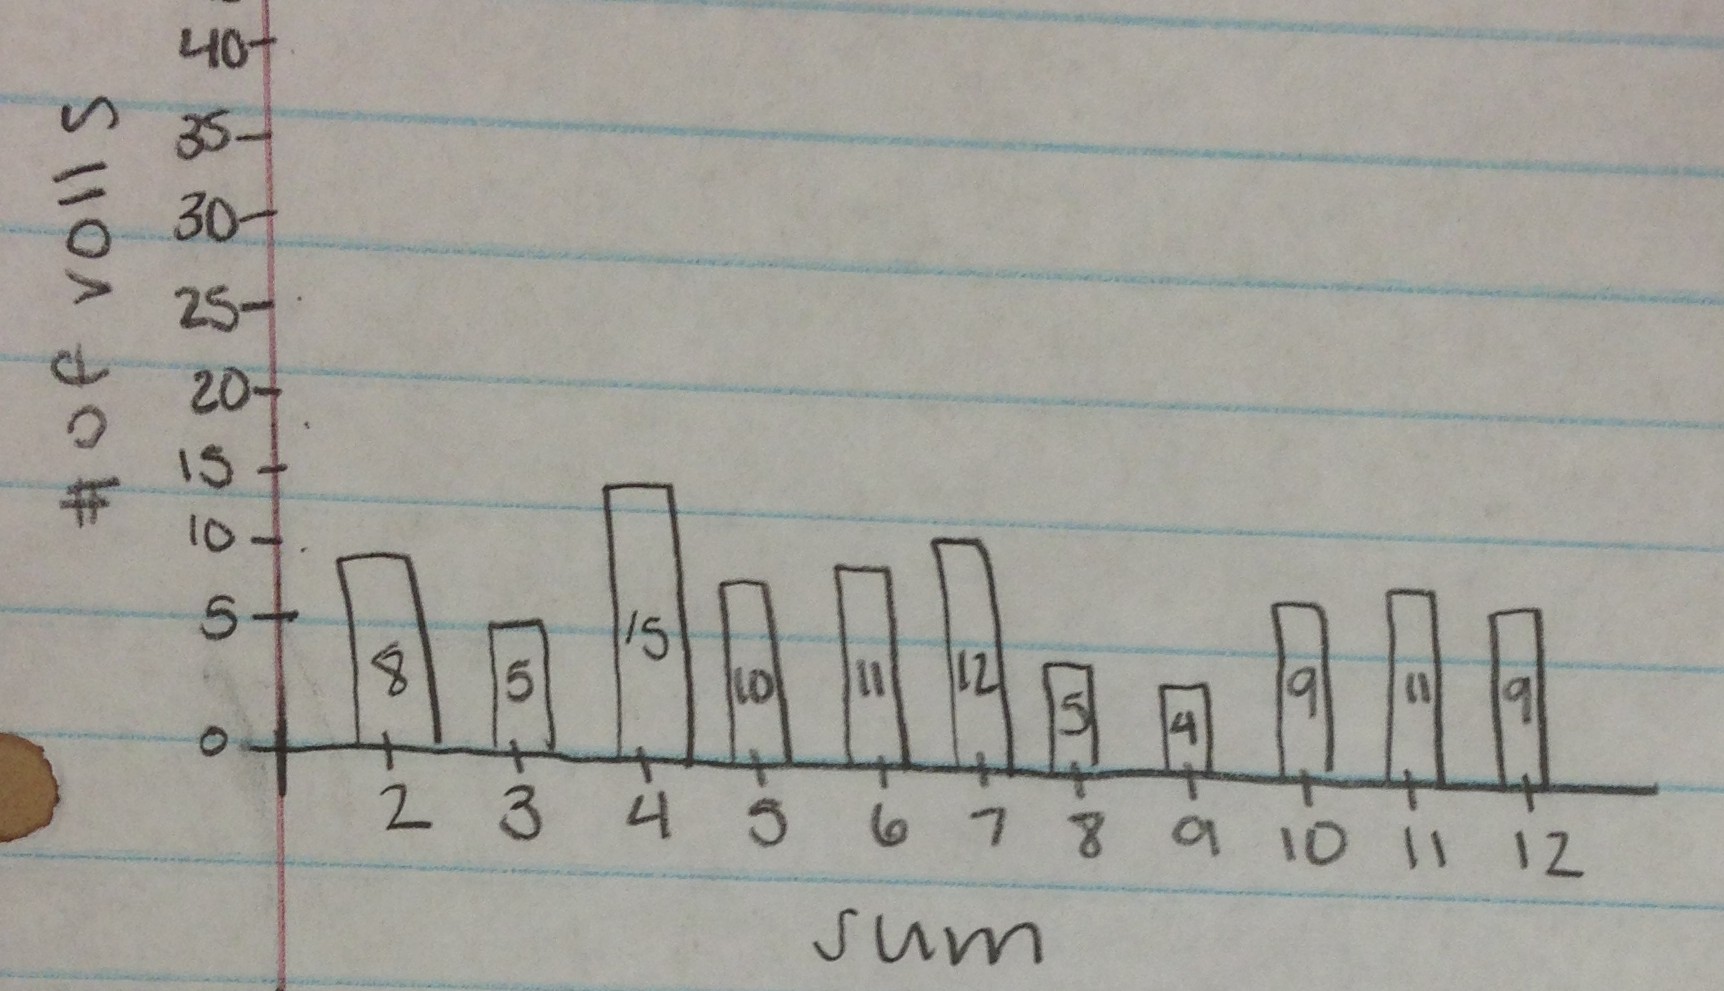
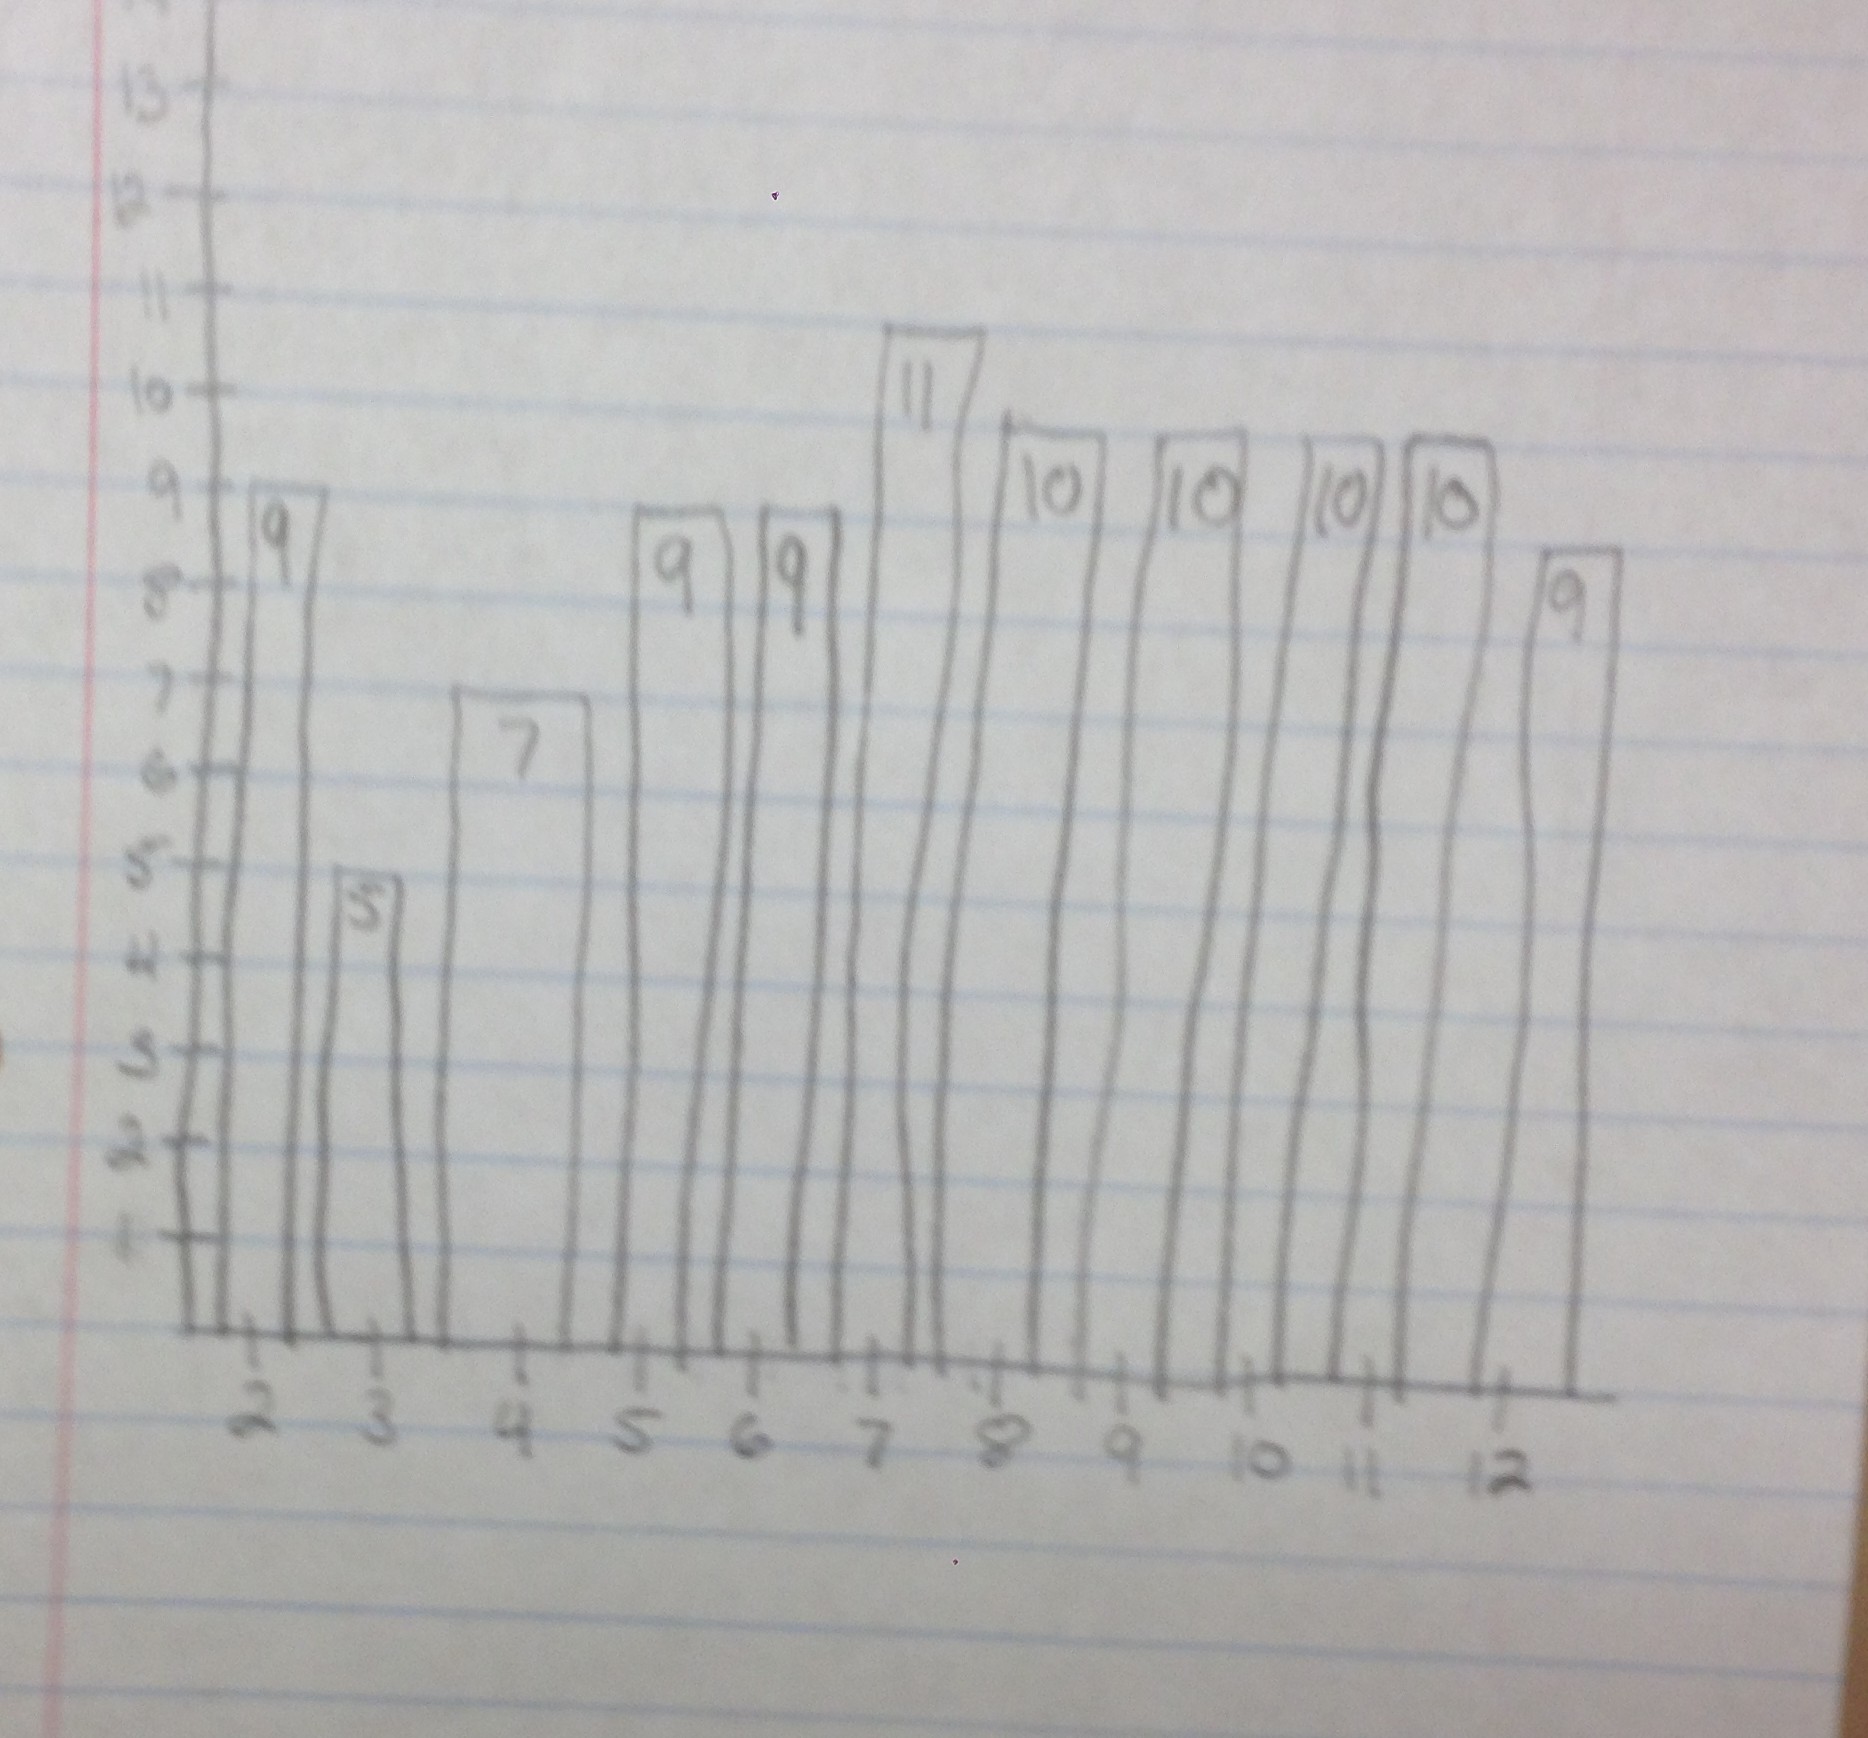
Just Random
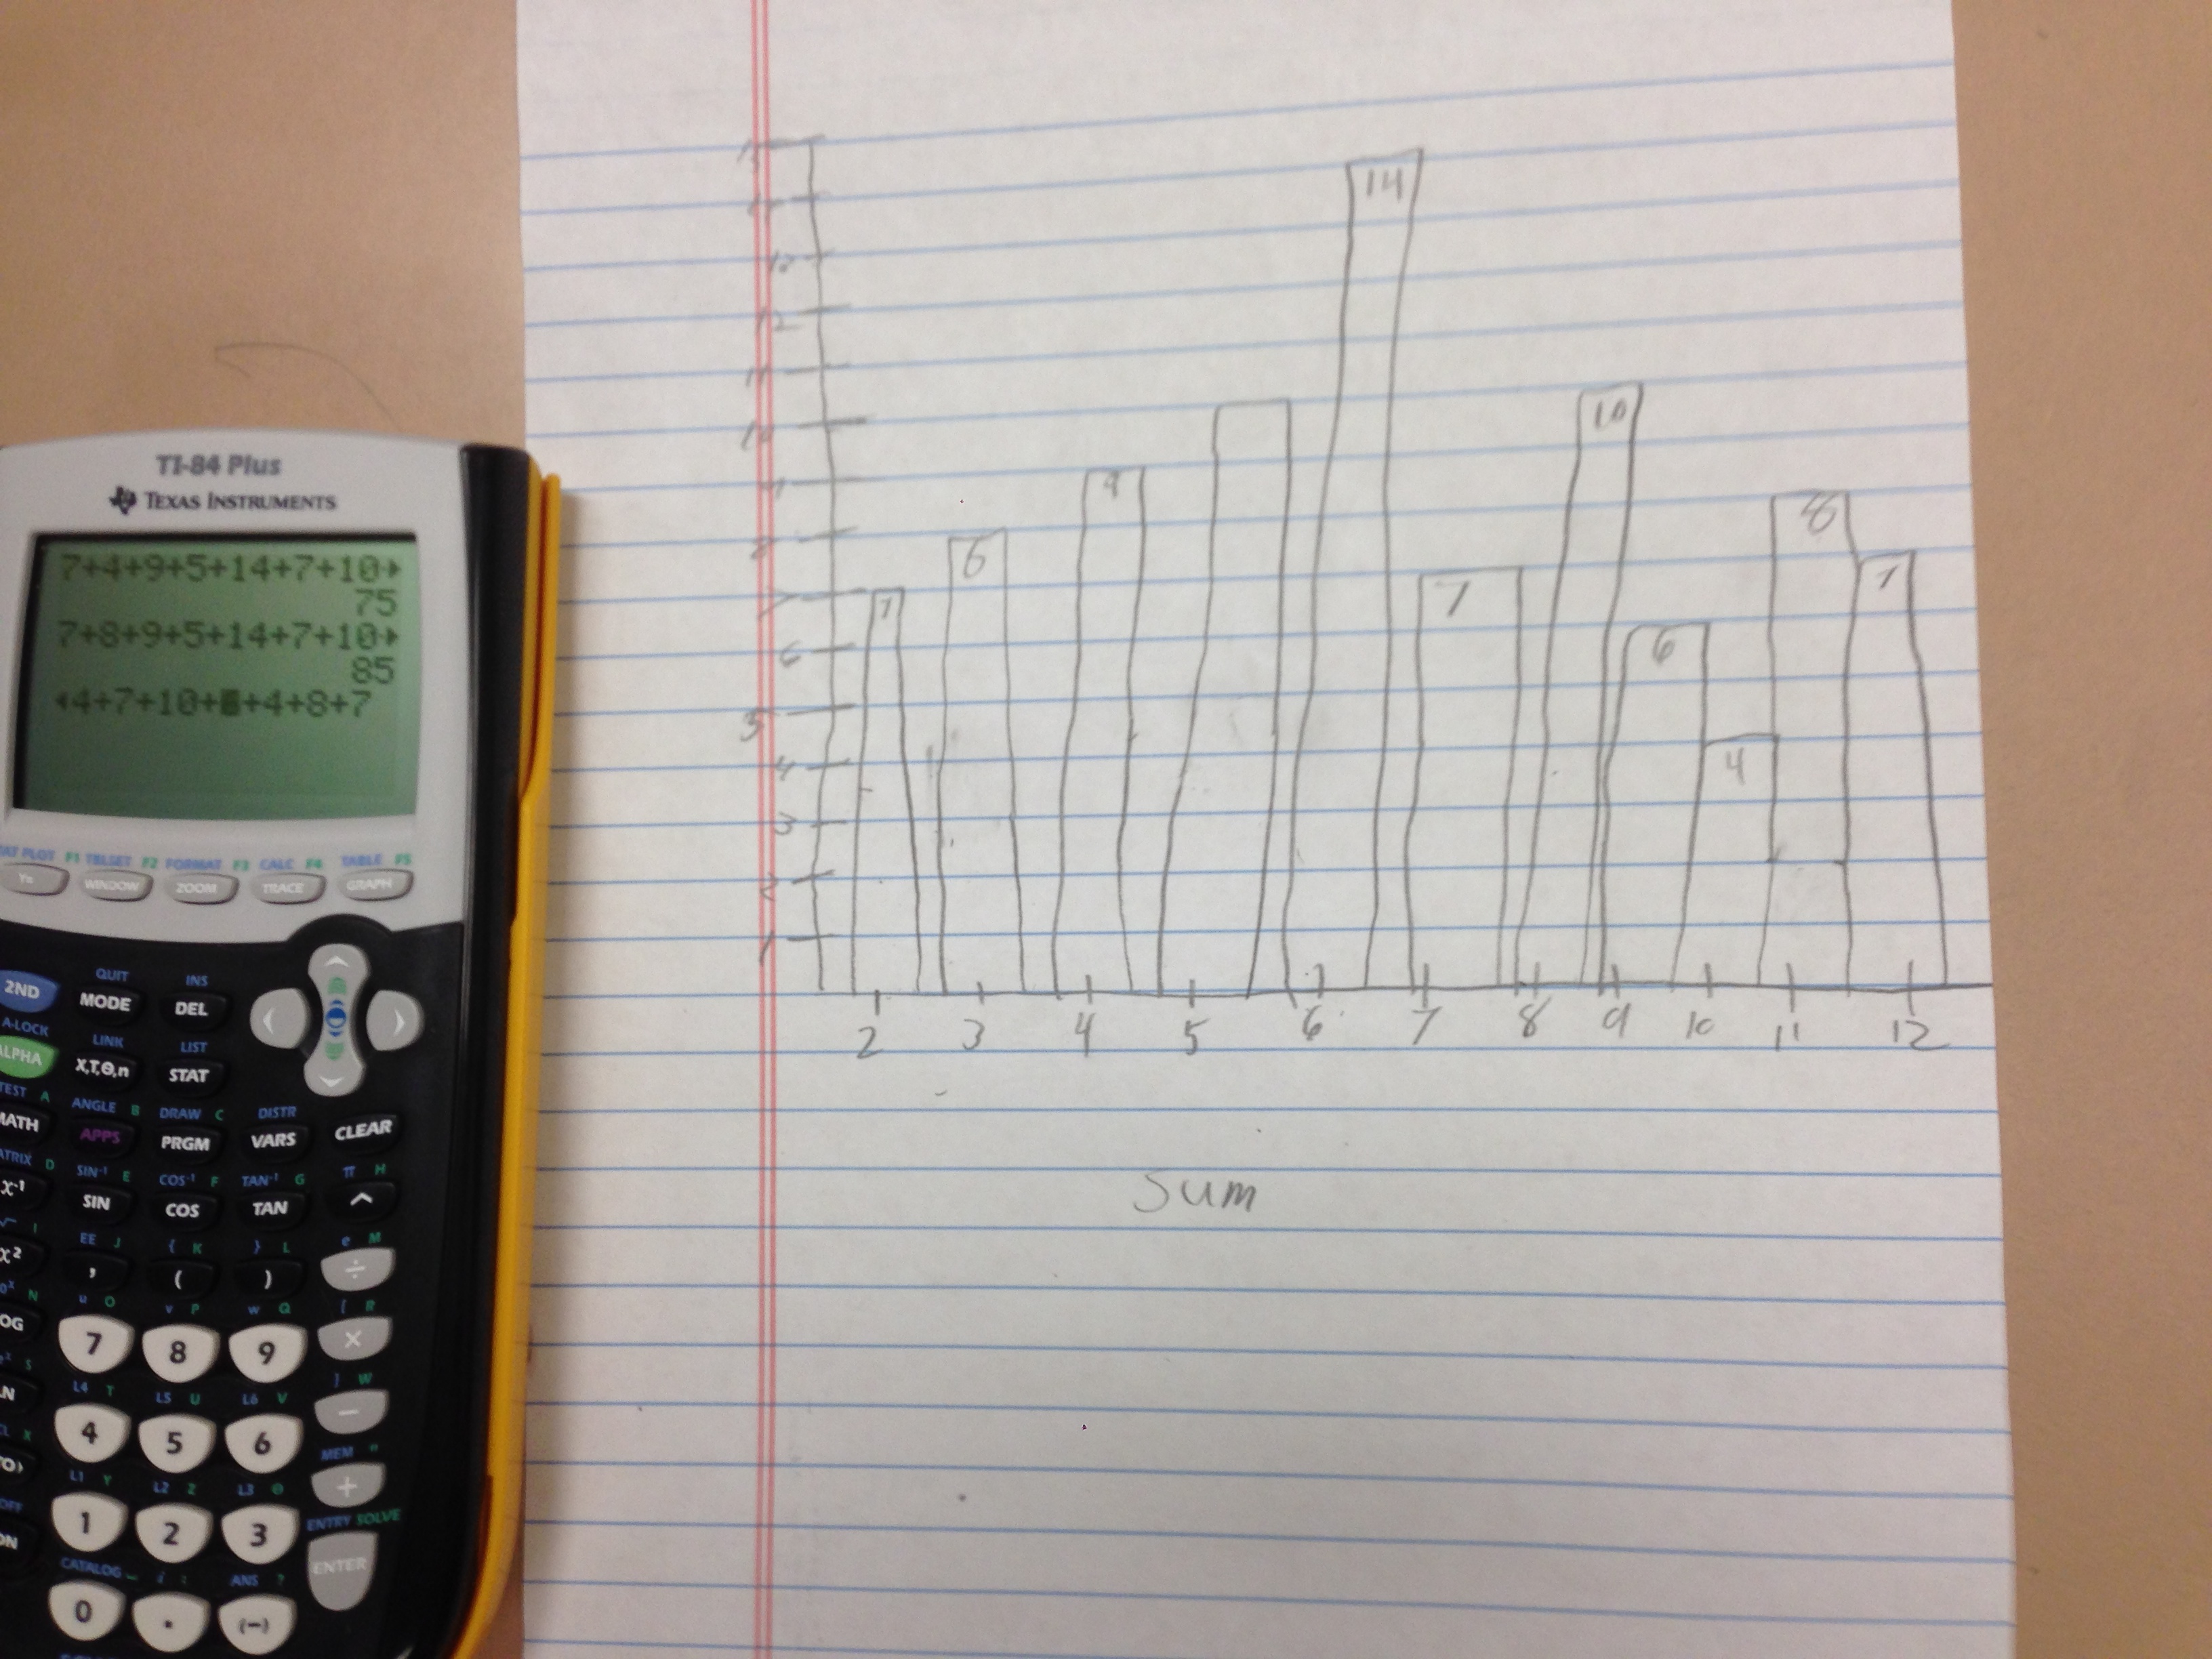
Peak in Center
I ask the kids if there are any other strategies for their predictions other than the ones we have discussed. One student added that maybe 2 would show up least often and 12 the most, increasing in between. Discussion ensued.
It’s fascinating to me to actually see the students discover what happens and why. I used to have them use the probability simulator on the TI-83/84 but I just don’t trust TI to do anything random anymore. Plus, there’s something more “real” about actually rolling the dice.
They then can compare the graphs of their predictions to their results and discuss differences and reasons for them. 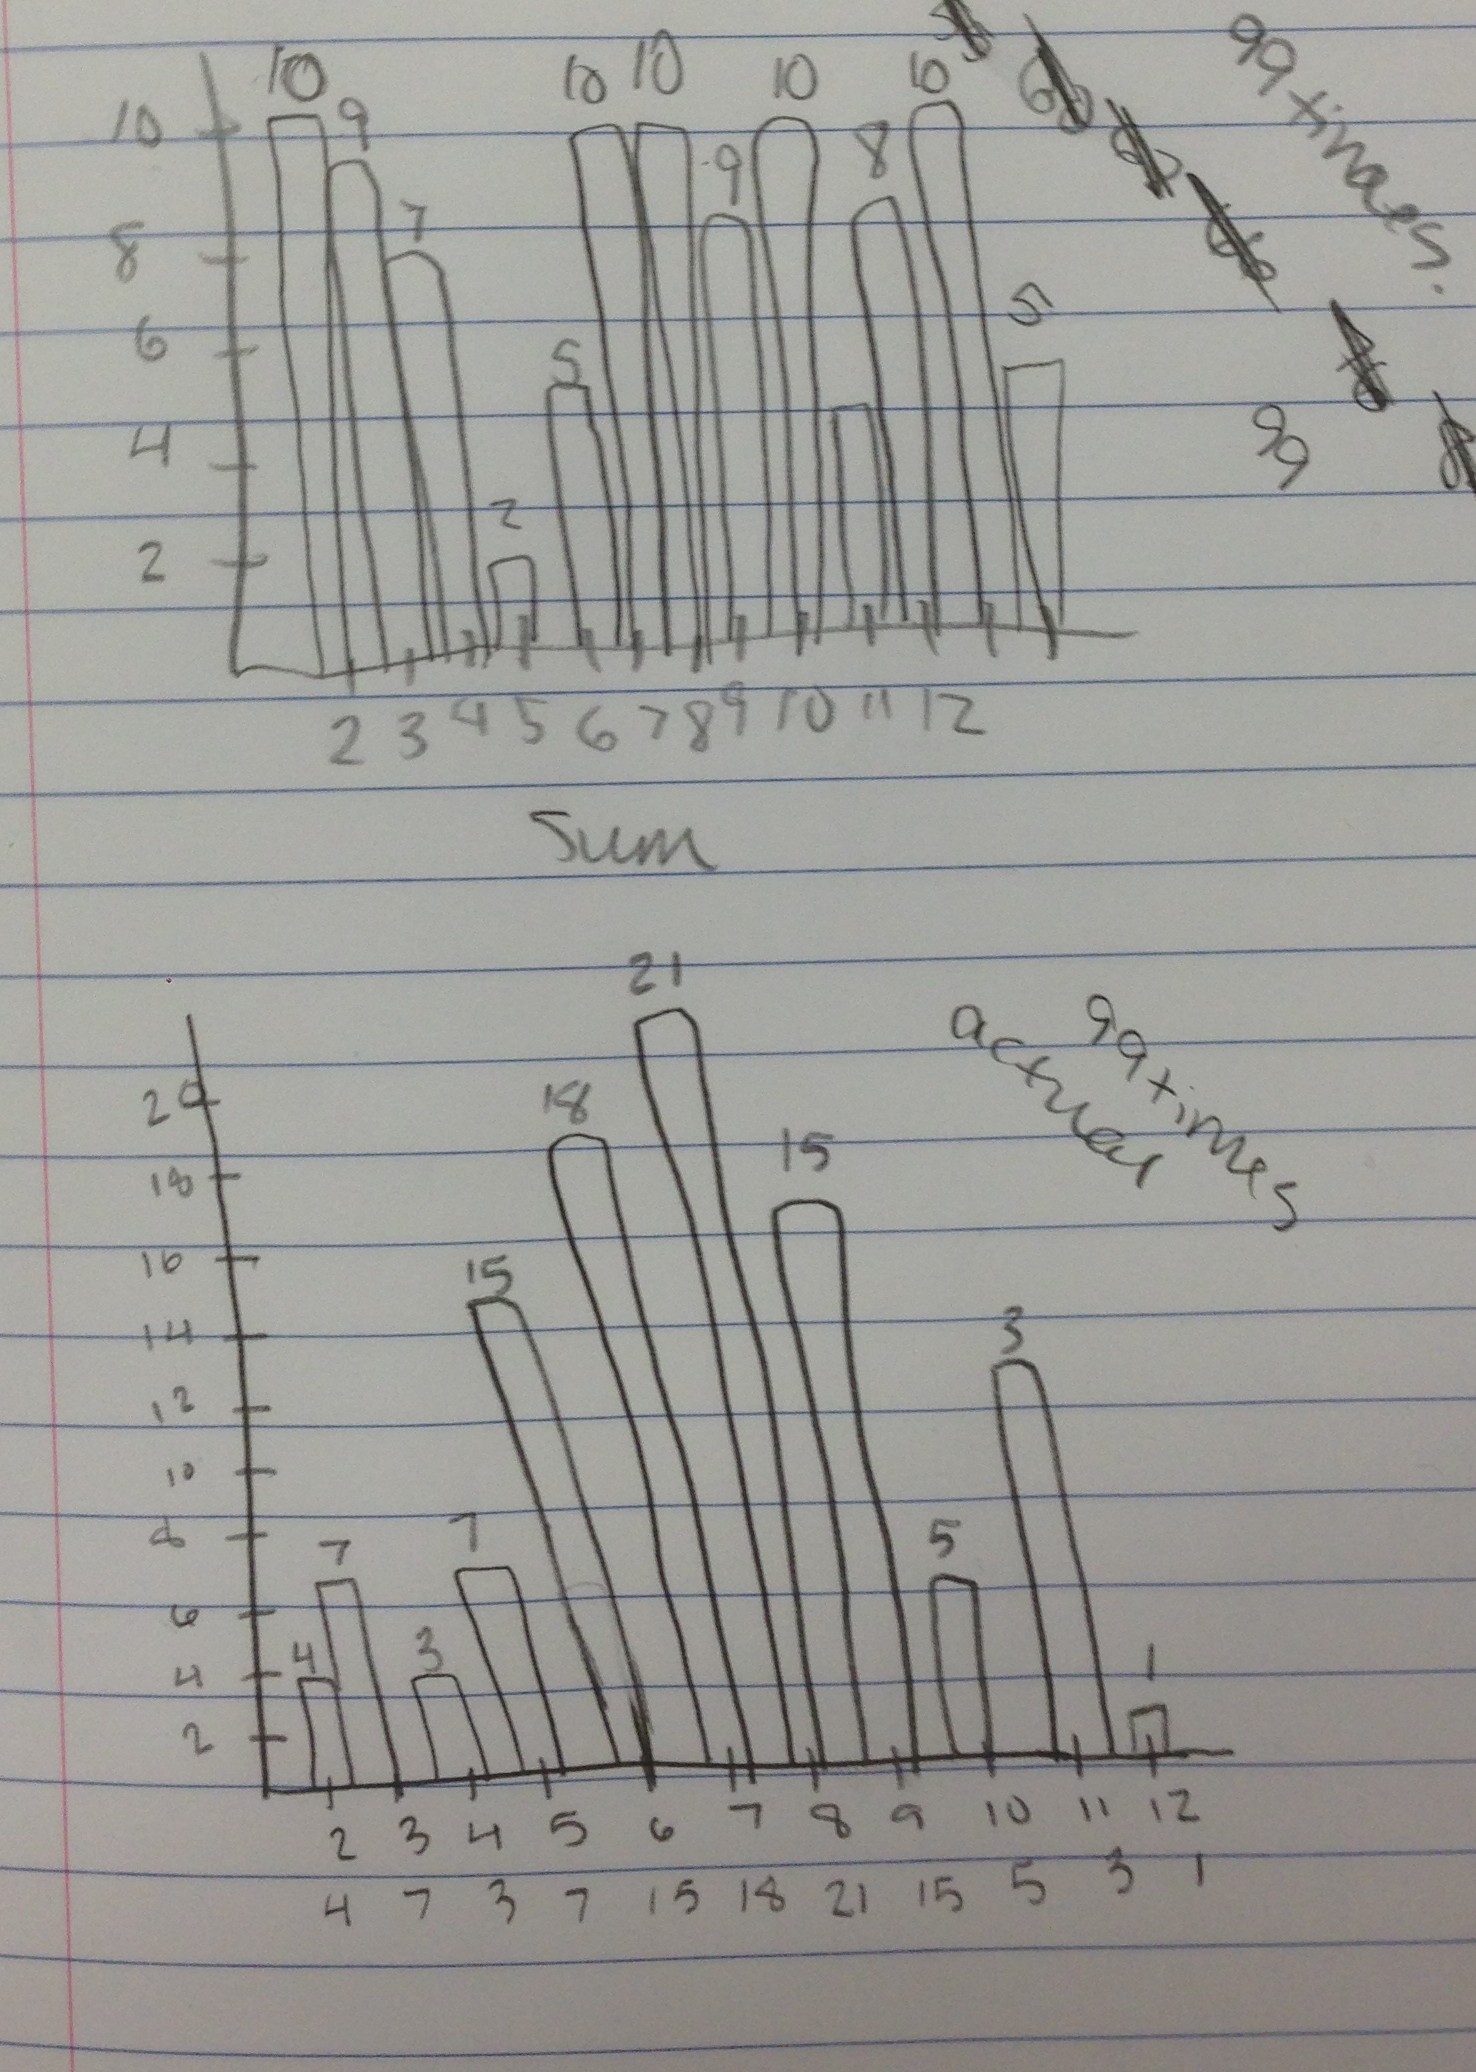
A question that blew me over today: If we roll two dice over and over, which will happen first – a. rolling a sum of 7, sixteen times, or b. rolling 100 times altogether?
I’m wondering , in a class of 30, what the aggregate results will be on this mystery question.

I love working on probability with my students. I like the idea of having students graph the probability distribution before rolling the dice. Brilliant!