Today was a banner day in my ninth grade probability and statistics class.
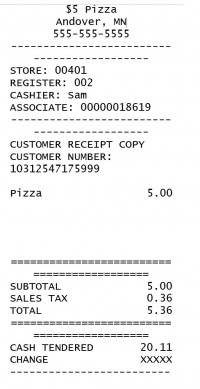
First, our number talk was a bite out of the real-world and not the “you and 5 friends share 8 pizzas” kind of real-world. When my daughter has a babysitter, as she did last night, I usually spring for pizza. (Yes, our vegan lifestyle maintains a real iron-grip on nutrition when mom and dad are gone.) I even splurge on the good stuff: $5 Pizza.
With tax, my vegan-less vice cost $5.36. I gave the cashier $20.11. How much change did I receive?
Lots of great strategies: counting up, counting down, counting to the middle even. It’s worth noting that the two students in each class that insisted on stacking the numbers and borrowing were not able to do so correctly. I say this not to discount the standard algorithm. Rather I wish to point out that in this case, when it’s necessary to borrow three times, the standard algorithm is blatantly inefficient.
The students had to know why on earth I would give the cashier $20.11 rather than just $20. The answer: Quarters. Because if you’re at the store with a 4 year old and you do not have a quarter for a gumball machine, god help you.
The main portion of the lesson was the real magic. This problem is from Strength in Numbers by Ilana Horn:
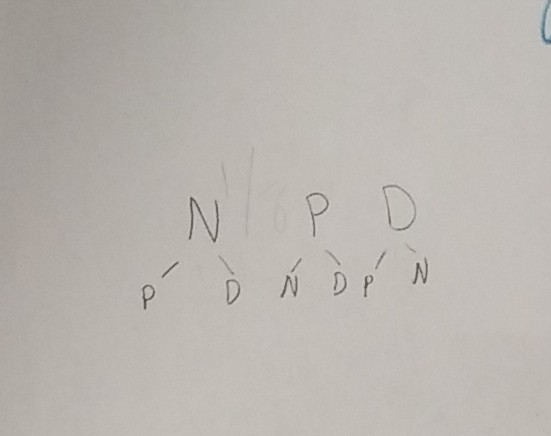
Imagine that you have two pockets and that each pocket contains a penny, a nickel and a dime. You reach in and remove one coin from each pocket. Assume that for each pocket, the penny, the nickel, and the dime are equally likely to be removed. What is the probability that your two coins will total exactly two cents?
They sit in groups of three or four. I gave each group a large piece of paper, had them put a circle in the middle for their final solution and then divide the paper into 4 sections for their individual work. When looking through my pictures of student work, I noticed that I have a tendency to capture correct work (but differing methods), but I do not take photos very often of incorrect work. Today, I changed that.
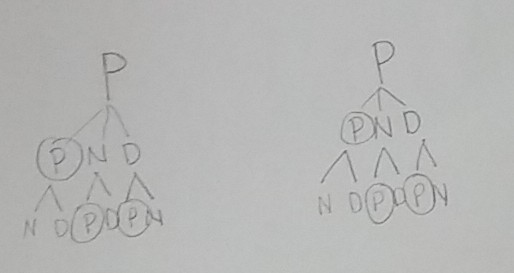
Here is a sample of their strategies for determining the number of outcomes:


The level of discussion was exquisite. But what’s more important was that they were able to work together to organize their thinking and to make sense of their solution. They built on what they knew an gained conceptual understanding as a result. In addition, they were able to focus on understanding their path to the solution rather than simply being satisfied with the solution itself. I’m very proud of them.

Good one Megan
I’ve found it interesting to see the differences between students who list outcomes and students who use tree diagrams. Sometimes, students who use diagrams go too far or not far enough with their branches. Other times, students who use lists miss outcomes or write them down multiple times. Either way, the results make for some good conversation in class and provide students with pros and cons of different strategies. By the way, I’m totally using that probability problem tomorrow! Thanks!