How many of you went nuts over the Google Doodle for John Venn’s 180th Birthday? I have no shame in admitting I spent more than a few minutes messing around with it.
These not-so-modern overlapping circles of wonder have fascinated mathematicians, scientists, and even linguists alike. When searching for rich tasks for my college algebra classes, I came across this new twist on the traditional Venn diagram:
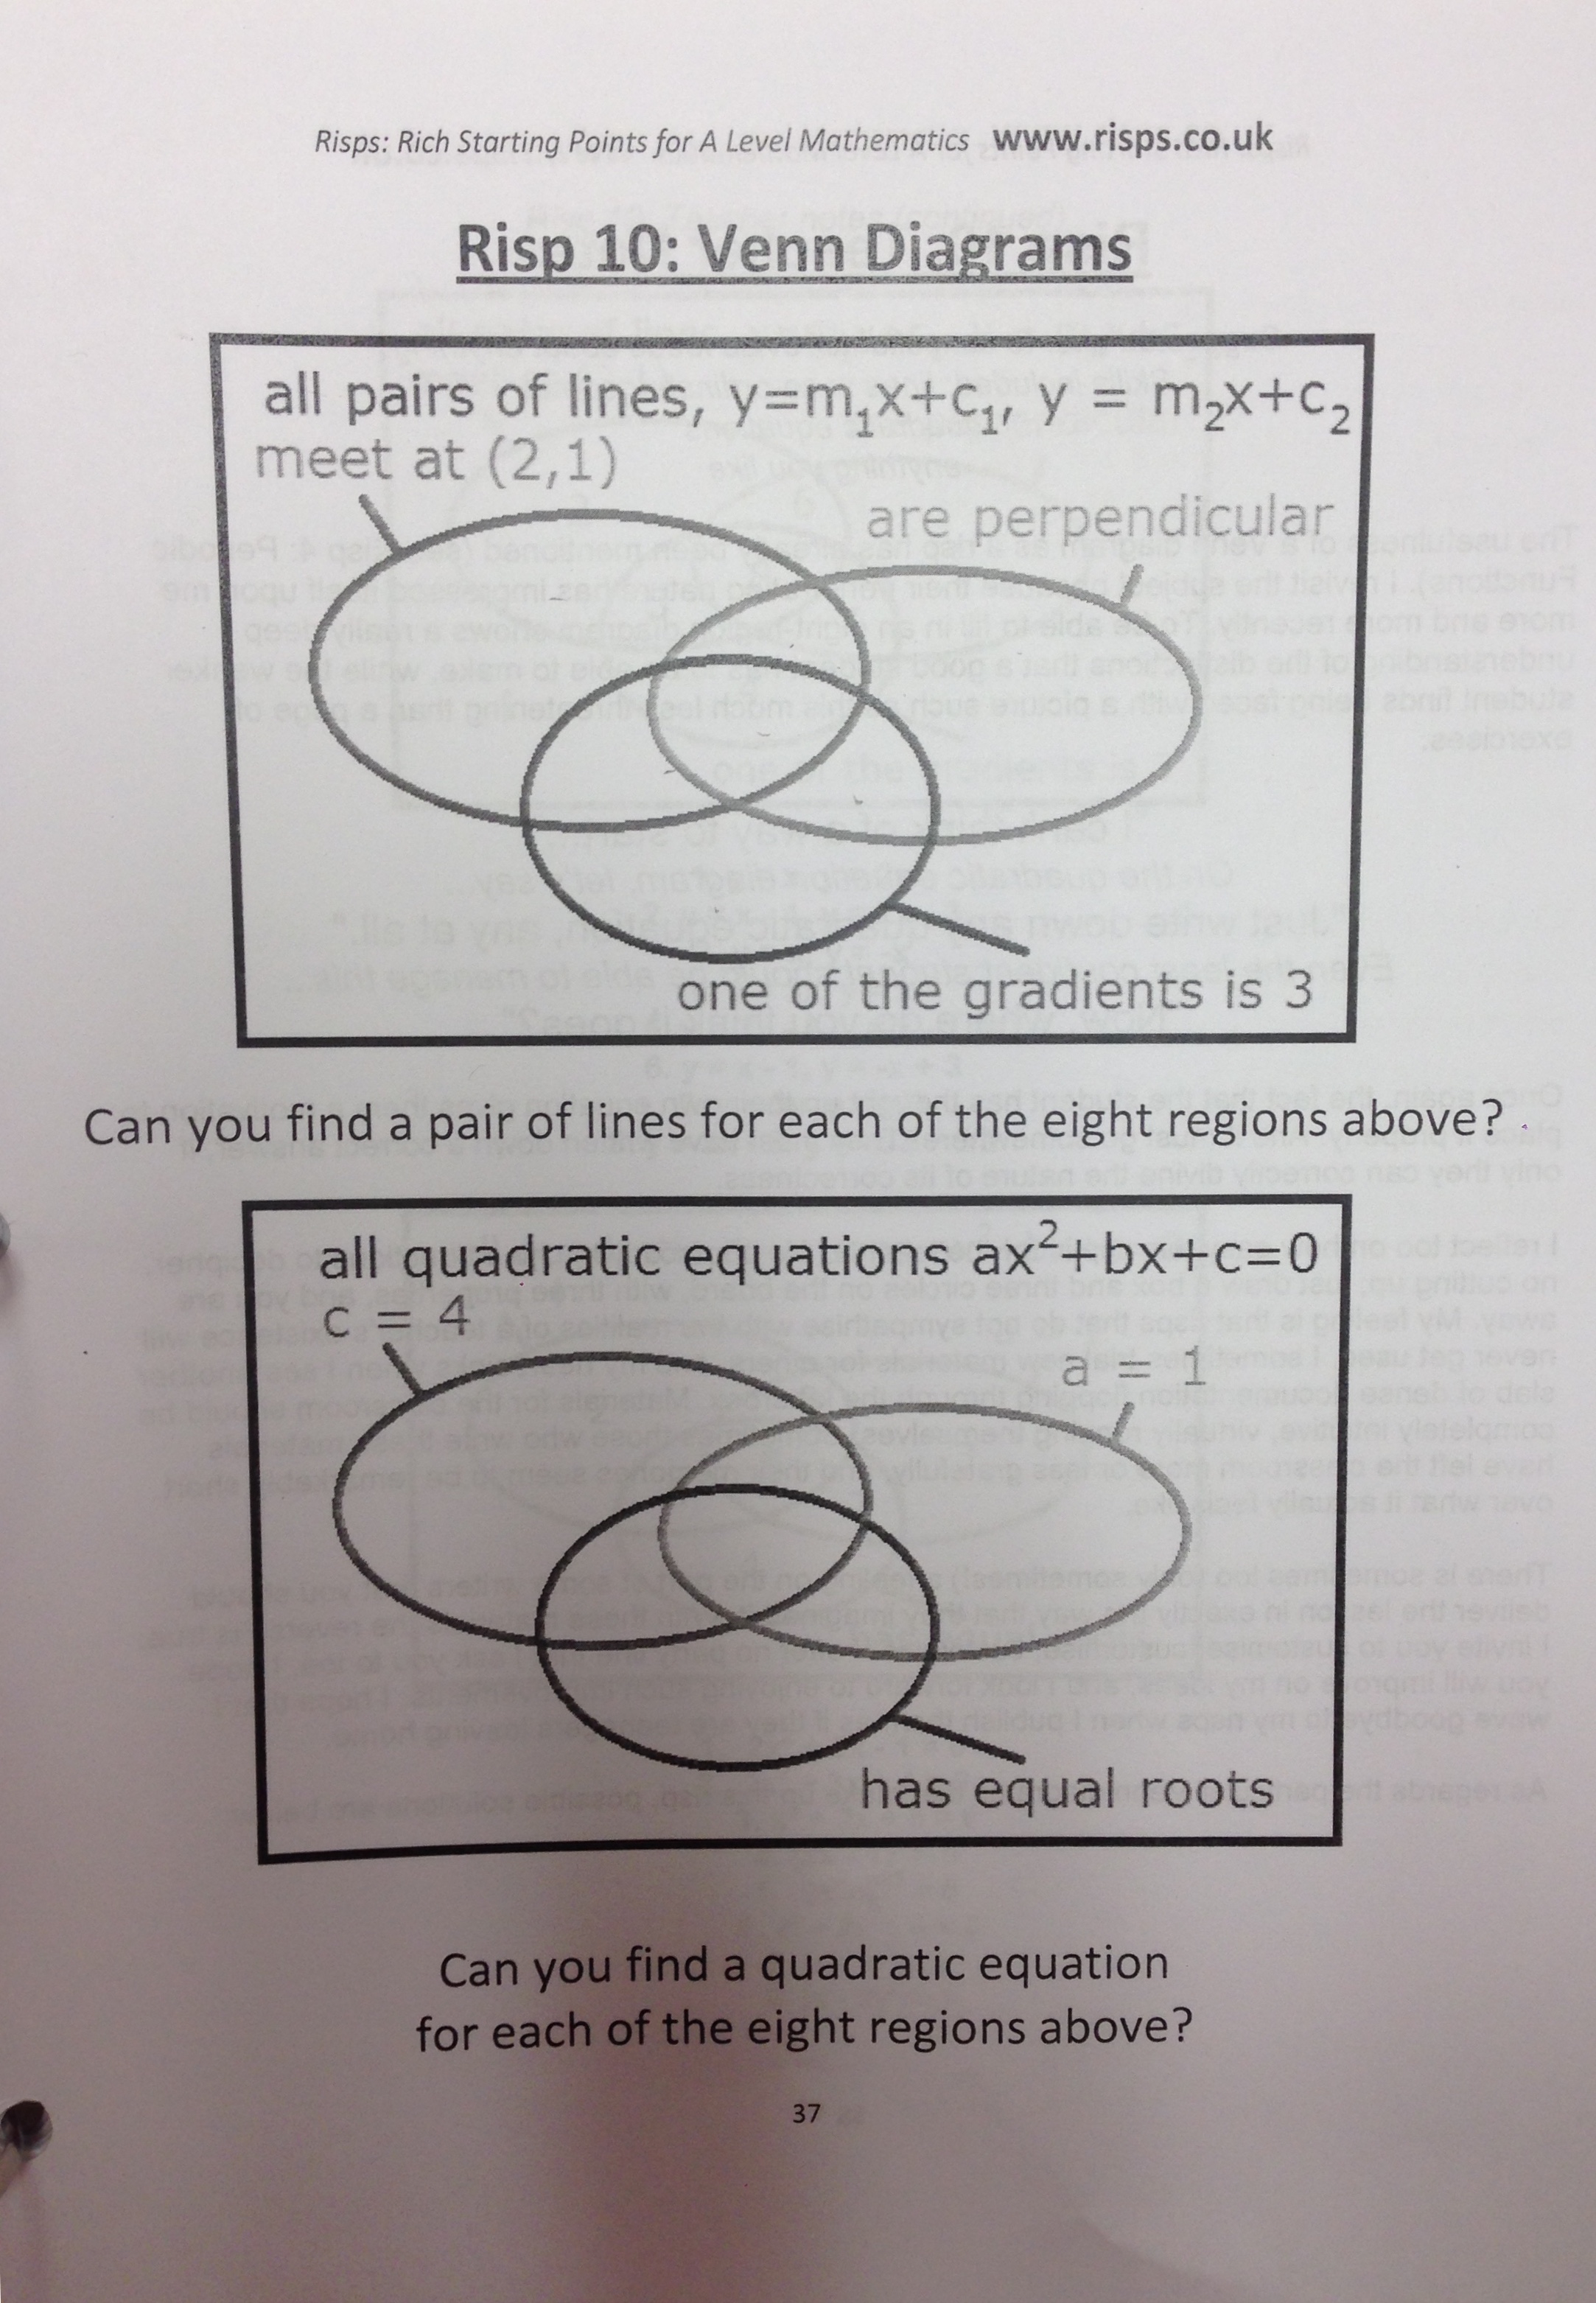
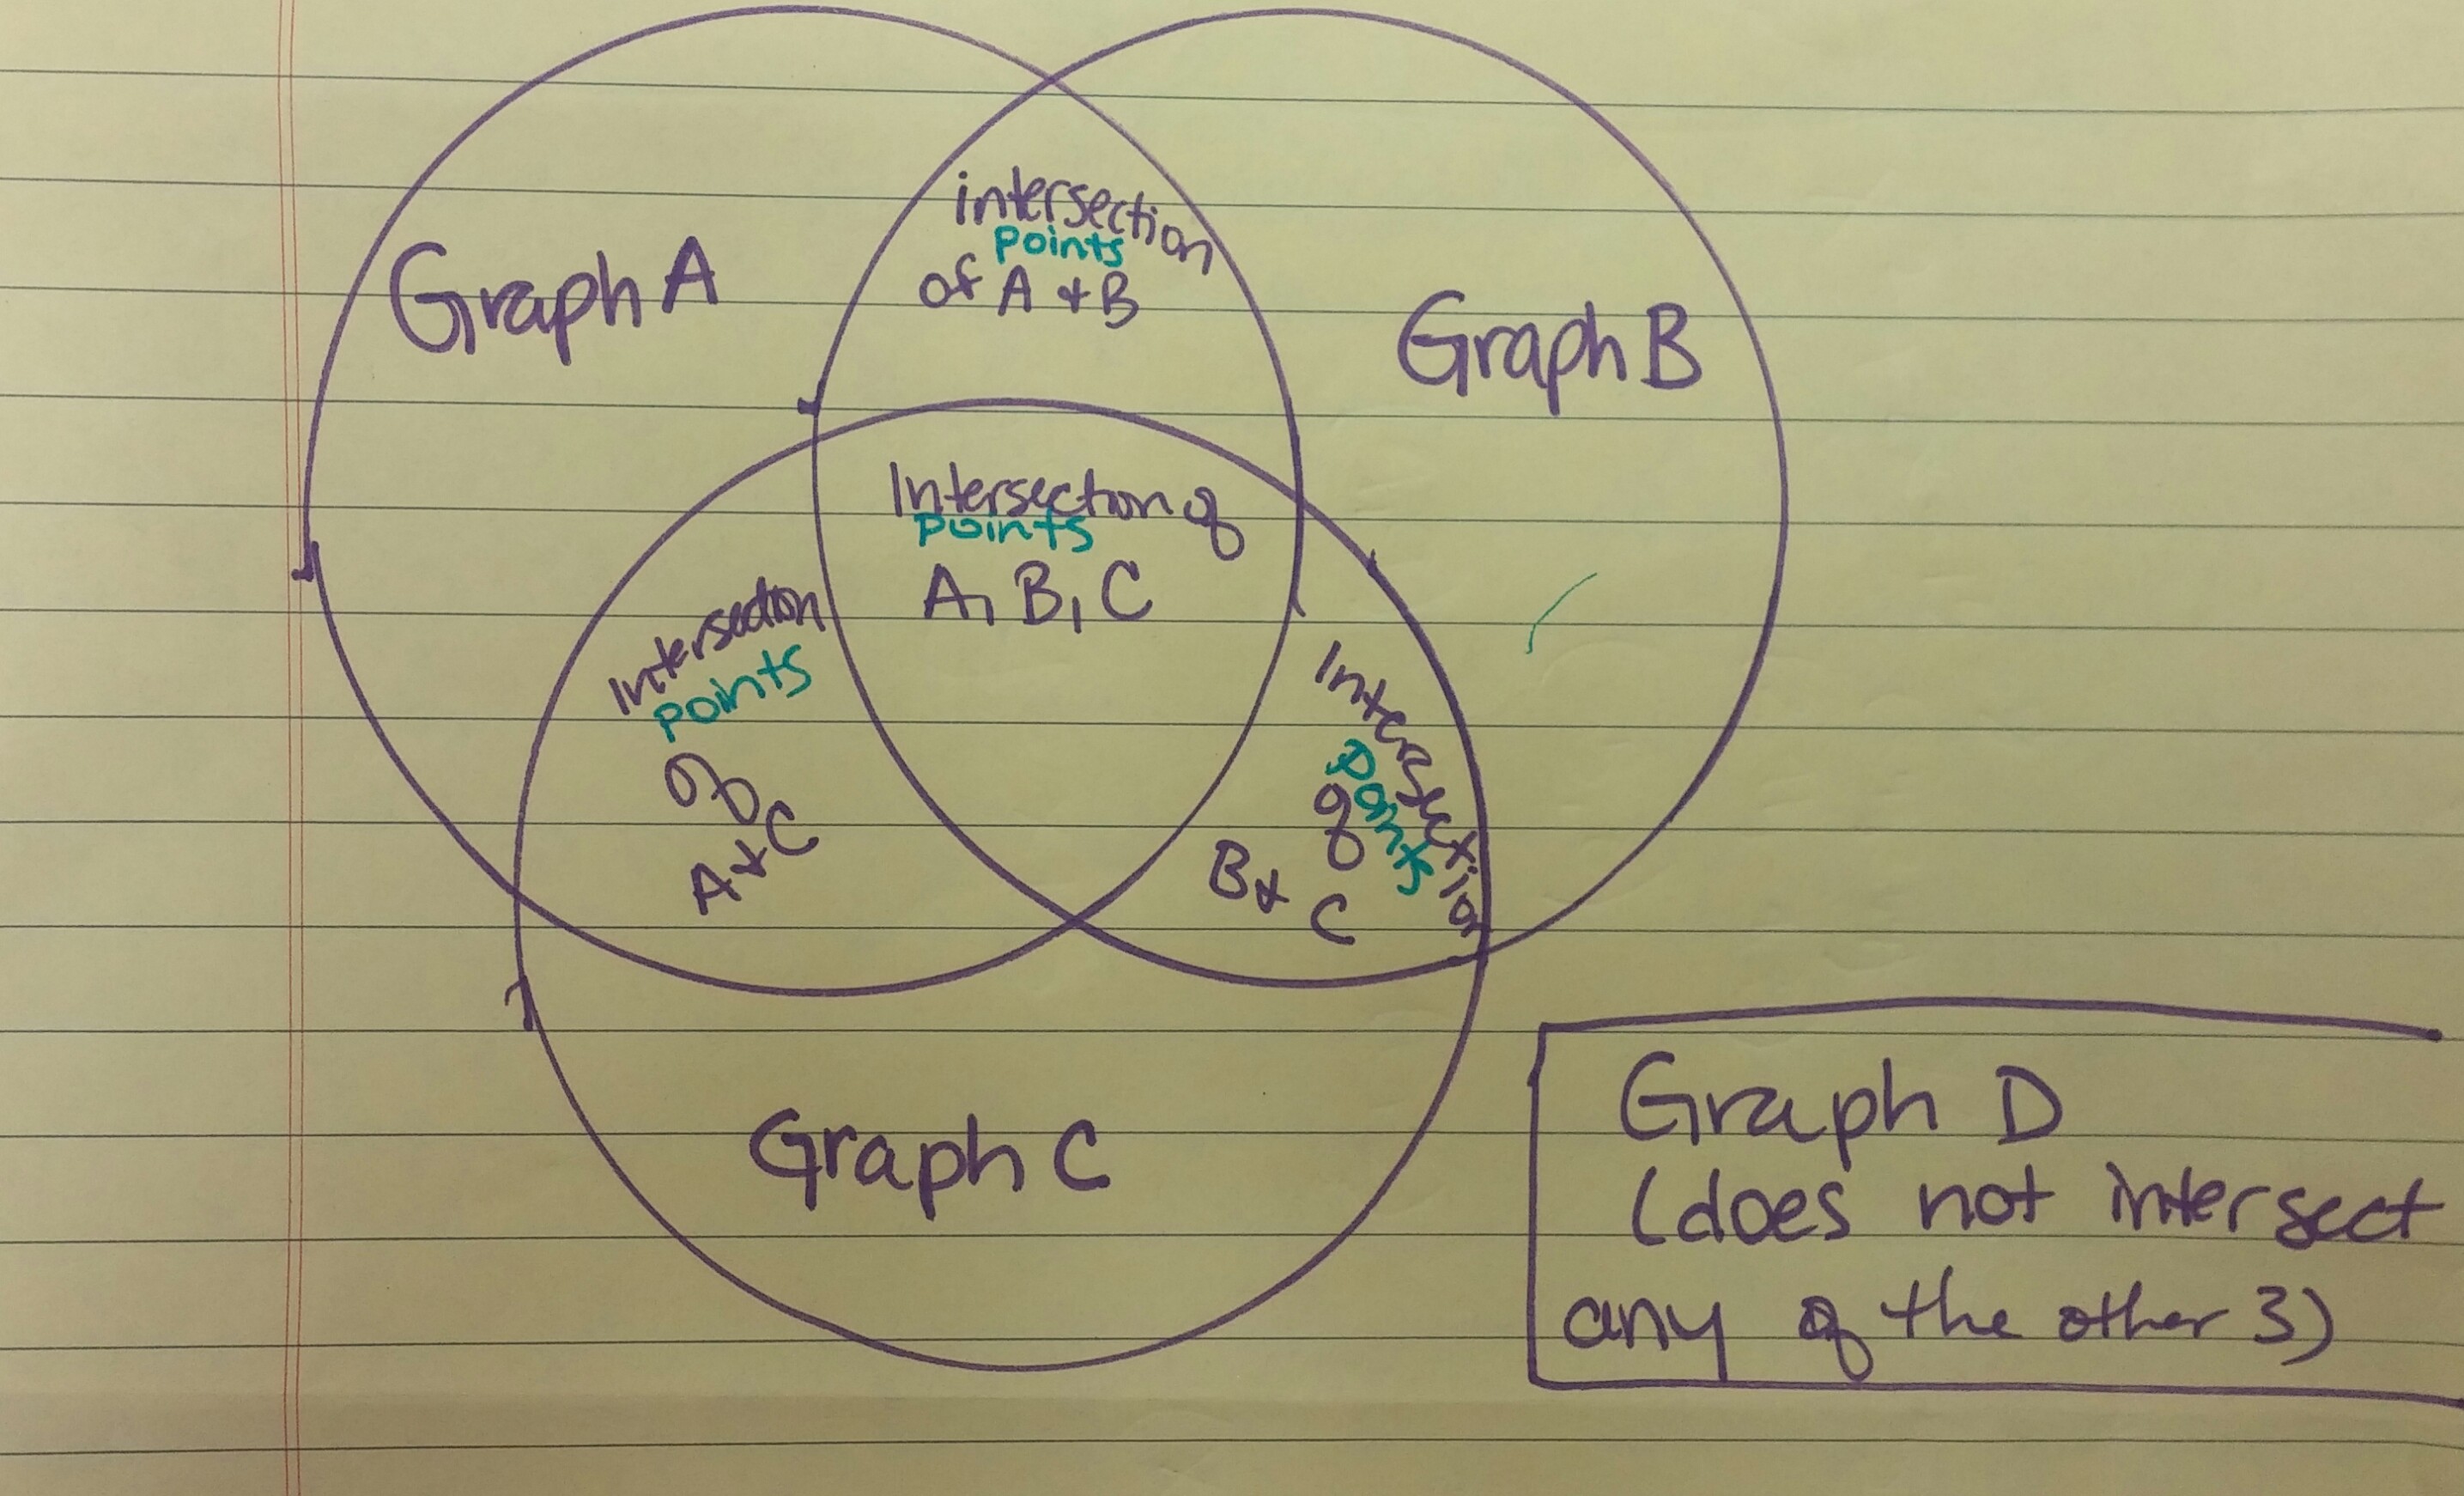
This activity can be applied to all kinds of topics with the main task being to find an equation to fit into all eight of the Venn diagram regions. Since we are working with systems of equations, I offered this challenge to my classes:
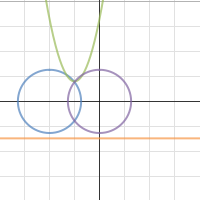
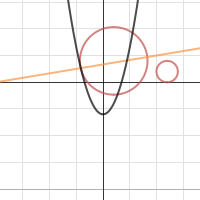
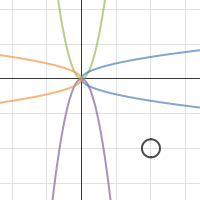
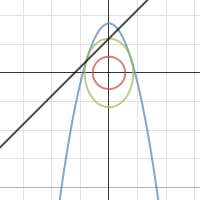
Can you find three graphs that all intersect and also each intersect one another at unique points? Also, is there a 4th graph that does not intersect the first three?
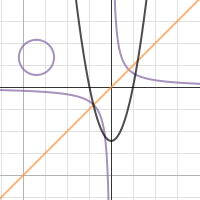
Out came the iPads and Desmos. Here are a few highlights:

Some of my observations during their work time:
- A few of them assumed we were creating an actual Venn Diagram with Desmos. I made sure the expectation was more clear the next period.
- Attention to precision was important. Some students assumed that if the three graphs appeared to cross one another, their task was complete. They were mistaken when I zoomed in to examine the intersection points.
- Students assumed that if a graph did not intersect another in their viewing window, it didn’t intersect at all. We had some good conversation about where graphs might cross as the x and y approached infinity.
- Using sliders in Desmos makes this task more doable in one class period.
- I wonder if they would be able to solve for their intersection points algebraically.
Side note: these RISPs (Rich Starting Points created by Jonny Griffiths) are all available on this website, and are excellent starters for college level mathematics.

